Analyzing Detection Events
Threats Xplorer provides a wide variety of columns and filters to help you navigate through the events list. You can either select filters from the drop-down menu or type in keywords that match your desired results.
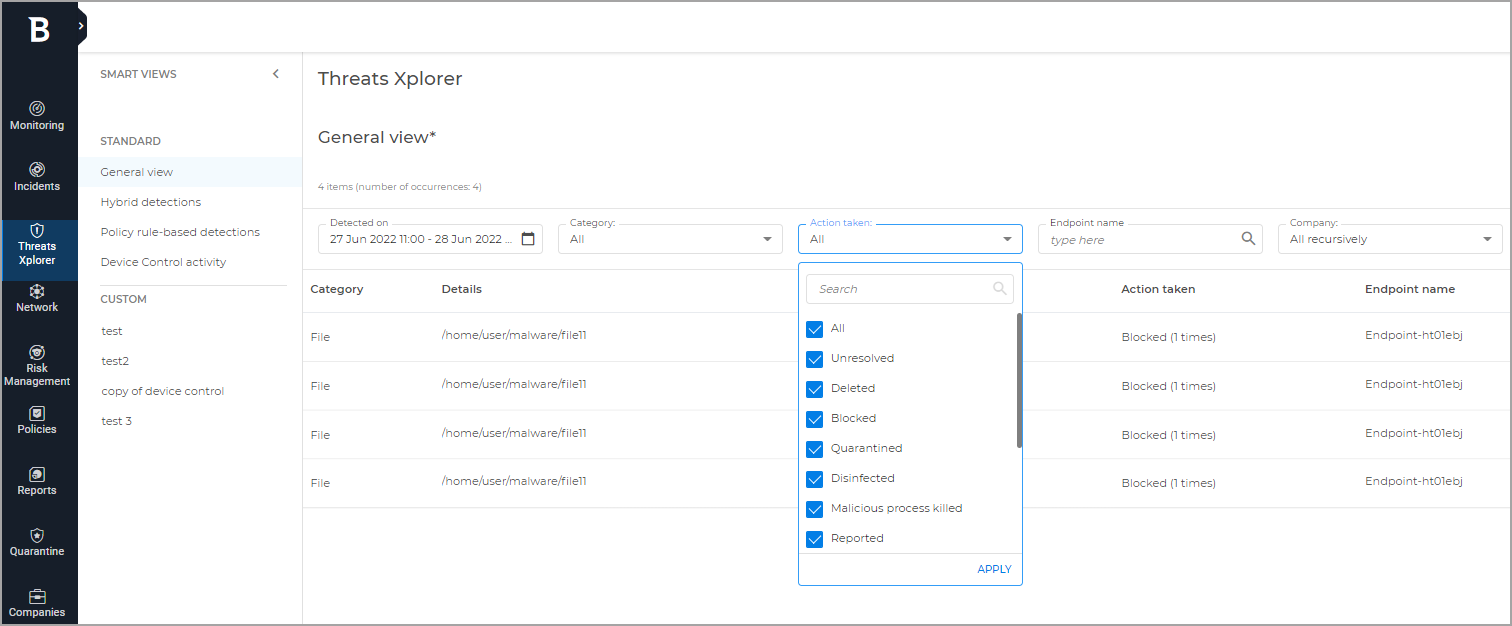
The available columns and filters you can use are:
Detected on
This column provides you with the exact time and date of the detection. Use the filter to view events that occurred in a predetermined time interval or a customized one.
Company
This column displays detection events based on companies. You can select one or multiple companies and view the specific collection of events. You can also view events from all companies that you manage directly or from all companies you have access to by using the dedicated filters.
Category
This column classifies the identified threats using general categories such as files, emails, websites, processes, and others.
Details
This column provides specific information about the identified threat, such as the path of the file or process, the web address of the website, the email subject, and more.
Action taken
This section presents the action taken on the threat as well as the number of occurrences. For example, using the available filters you can view blocked, deleted, quarantined, reported items, and others.
Endpoint name
This column provides you with the name of the device where the detection occurred. You can search for a specific device by typing its name in the filter search bar.
Command-line
In this section, you can find details about the command line used in the detected threat, if any.
Threat type
This column presents the discovered threat type. You can select one or more types from the filter and identify the corresponding events. For more information about the available threat types, refer to the Glossary section.
IP
In this section, you can find the IP address of the device where the detection occurred.
Endpoint type
This column provides information about the device type, whether it is a server, workstation, container, or container host.
User
In this column, you can find the username that was used in the attack.
Detecting module
This section provides you with the name of the GravityZone module that identified the threat. You can use the filter options to refine the list of events.
Detecting technology
This section provides information about the GravityZone technology used to identify the threat. You can use the filter options to refine the list of events.
Threat name
This column presents the exact name of the identified threat. You can search for events with a specific threat by typing the name in the filter search bar.
Fileless attack
This column provides details about the existence of a fileless attack.
SHA256
You can use this column to find information about the hash of a file and the associated filter to discover events with a specific hash.
Tags
The column and filter display the automatic or custom endpoint tags available for the selected companies. You can filter and view detection events from endpoints with specific tags, with custom or automatic tags only, or from endpoints without any tags assigned. Tags do not apply to unmanaged endpoints or Security Server instances. For more information, refer to Using endpoint tags.
Note
The items number located above the columns on the left side of the page represents the total number of detection events according to the selected filters. Additionally, you can find the number of occurrences that specifies how many times an event was detected.
To manage the Threats Xplorer page, use the options available on the upper right side. You can export data, adjust columns, clear filters, remove the filters section, refresh the grid, and adjust it to a compact view.
Detection details
The Detection details panel helps you perform an in-depth analysis, providing event-specific information and several investigation and remediation actions.
To analyze an event, select it from the grid and view its details in the opened panel on the right side. The panel includes:
Event details:
Information about the threat such as threat type and name, the action taken, the detecting module, and others.
Details about the detected item, including category and specific information like process ID, file path, URL, email subject, and others.
Endpoint details such as endpoint name, type, and risk score, assigned endpoint tags, assigned policy, any existing vulnerabilities or misconfigurations, and others.
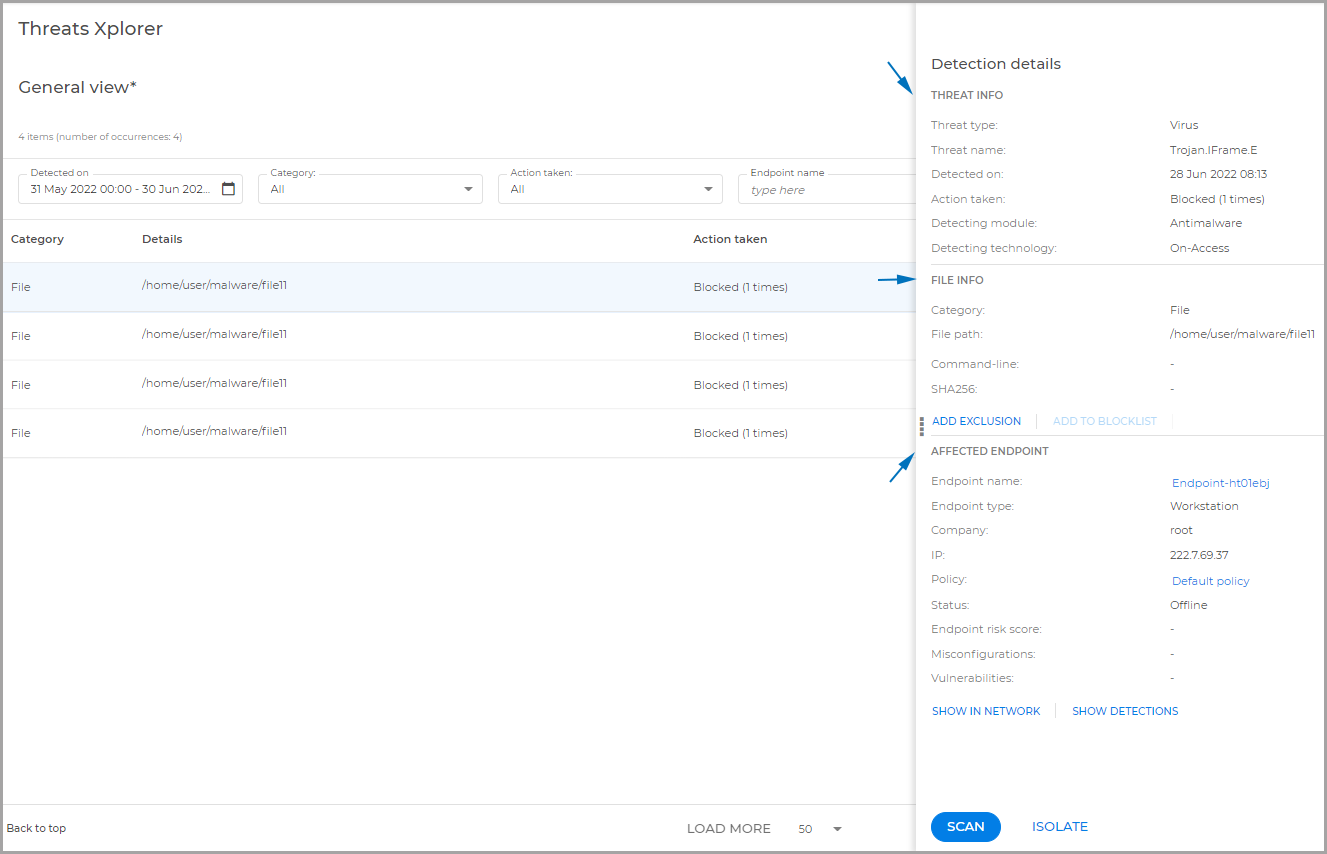
Actions:
Scan: configure and start a scan task for the endpoint.
Isolate: use this action to isolate the endpoint from the rest of the network until the threat is resolved.
Add exclusion: create an exclusion for the detected item. This action is available for files and processes.
Add to Blocklist: add the detected item to Blocklist. This action is available only if the item hash is present.
Show detections: view all the security events on the endpoint within the last 24 hours.
Show in network: view the endpoint within the Network Inventory.
For an improved security analysis and overall accessibility, you can access the Threats Xplorer page also from Executive Summary.