Splunk integration guide
You can use the free dashboard app in the Splunk app store to make mobile threat data more useful in protecting company assets. This provides a clear path to performing workflows to protect intellectual property.
Options and setup for data input in Splunk
The options for data input to Splunk are:
Data export through Mobile Security console using the Generic SIEM System integration. This is the most common choice for exporting data to Splunk.
Data export with Mobile Security console using the REST Endpoint integration.
Syslog pull script with a cron job.
Setup using the data export generic SIEM for Splunk
This option requires you to set up Splunk to accept the data from Mobile Security console, and also to set up Mobile Security console to export threat data.
Prerequisites for integration
Ensure you have these items determined before starting the integration:
Download the Splunk app from the app store and install it.
Ensure you have Splunk Dashboard access.
Ensure you have Mobile Security console access as an administrator.
Determine the Splunk IP address and port to use in the Splunk console and the Mobile Security console data export.
Get the Mobile Security console IP address to allow data communication.
Add this IP address to your allowed or safe list with your IT or firewall team.
Adding this IP address allows the export of data from Mobile Security console to your Splunk IP and port.
Setting up the Splunk console for TCP local input
To set up Splunk, perform these steps:
From the Splunk Home page, click Settings and then click Source Types on the right-hand side. The Source Types page displays.
Click New Source Type.
Provide the details about the new source type.
Click Save.
Set the input settings by Selecting the Source Type you added in the previous step > Set the App Context to the Bitdefender Splunk App > Set the Host field to either DNS or IP > Set the Index field to main.
Review the settings and click Review and save your work.
From the Splunk Home page, click Settings and then Data Inputs.
Click Add New from the TCP section of Local Inputs.
Click New.
Enter your port value, such as 5454. This is the value of your listener port. You also enter this later in the Mobile Security console setup.
Review your inputs and click Submit, and a display similar to this figure displays.
Setting up in Mobile Security console for data export and TCP
After you have set up the Splunk Console TCP, then set up the IP address and port in Mobile Security console. This is the same port that you used in the Splunk console setup.
To set up a data export, perform these steps:
Log in to Mobile Security console.
In the navigation pane, select Manage and click the Integrations tab.
Click the secondary Data Export sub-tab and then click the Add Integration button.
Click the General SIEM System integration.
Give a name for the integration.
Select Threats for the Data Type field, and the Filter Level of Elevated and Above.
The forensics information is not shown in the Splunk app, so you can leave the Detailed Forensics field unchecked to reduce the amount of data. The Detailed Forensics setting value is your preference, depending on your data requirements.
Click the Finish button to complete the Mobile Security console setup.
Testing your Mobile Security console and Splunk integration
You need to ensure that a threat has been reported after performing the setup steps to create new export data from Mobile Security console. In order to test if your IP address and port receive data, run the following command:
echo "Hello Splunk" | nc SIEM_IP_ADDRESS PORT
Setup using the data export REST Endpoint for Splunk
This option requires you to set up Splunk to the data from Mobile Security console, and also to set up Mobile Security console to export threat data. This option only supports threat information and does not support other types of data export information.
Prerequisites for integration
Ensure you have these items determined before starting the integration:
Download the Splunk app from the app store and install it.
Ensure you have Splunk Dashboard access.
Ensure you have Mobile Security console access as an administrator.
Determine the Splunk API key from the Splunk console. This key is generated in Splunk, and you set this value in Mobile Security console.
Locating the Splunk API key value
To retrieve the Splunk API key value, perform these steps:
Log in to the Splunk dashboard.
In the top menu, click Settings.
Click Data Inputs.
Click HTTP Event Collector.
Copy the Token Value field as the Splunk API key value and use this in the Format Value field in Mobile Security console.
Setting up the Syslog Pull Script and Cron Job for Splunk
This is another mechanism you can use to pull data from and push it to the Splunk app. This is a less common choice in exporting data.
Setup using the Sample Pull Script
Download and install the Bitdefender Splunk App from the Splunk App store.
Set up a script to pull events from the Mobile Security console environment on a scheduled basis and put the events in a JSON file at a location that Splunk can monitor.
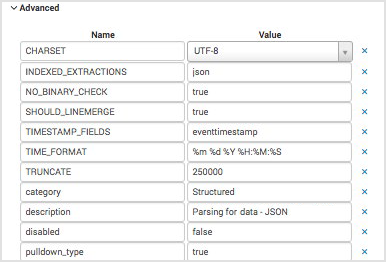
Create a new structured input type called Zjson
Login to Splunk through the web interface.
Navigate to Settings > Source Types.
Enter ‘Zjson’ for the name.
Enter a description.
Set the Destination app: Instrumentation.
Set the Category: Structured.
Set the Indexed Extractions: json
Set the Timestamp Extraction: Advanced.
Set the Timestamp Format: %m %d %Y %H:%M:%S.
Set the Timestamp fields: eventtimestamp.
Match the following values for the Advanced settings:
Add a Splunk input monitor for files to ingest them as they arrive. Perform these steps:
Navigate to Settings > Data Inputs.
For File & Directories click Add new.
Browse to the directory where the files are to be located by clicking on Browse and selecting the correct directory.
Click Next.
Set the Source type to Automatic and choose Zjson for the Splunk App Release 1.0. For the Splunk App Release 1.2, the data model is used.
Set the Host field as
Bitdefender Mobile Threats.Set the Index to Main.
Click Review and then Submit.
When including forensics in the threat information for input into Splunk, the maximum input line needs to be extended to at least 150,000 characters.
Setup the Cron Job
To add a Splunk input monitor for files to be ingested as the file arrives. To perform this, copy the script into the /splunk/bin/scripts folder and make it executable.
Next, create the folder to store the syslogs.
Select the Interval Input.
In the navigation panel, select Settings, then select Data Inputs.
Under Scripts, click on Add new.
Select the Script Path.
Select the Script Name.
Leave
Commandas the default.Select the Interval Input.
Select the Interval.
Click Next.
For the Input Settings and Source Type, select zJSON.
Set the App Control to Bitdefender Splunk App.
Set the Host field as Bitdefender Mobile Threats.
Set the Index according to the Data Model Option preferred.
Click on Review, and click on Submit.
Splunk Dashboard app
The Splunk Dashboard app helps create visually compelling dashboards.
Data model
The model consists of the following information:
Users.
Devices
Threats
Splunk app functions
The Dashboard presents multiple statistics in graphical and other formats for easy viewing of the current state of the mobile threat environment in the organization. Choose the sampling interval at the top of the page to include the ongoing data to be monitored. Each frame is live and can be clicked to see the raw data and search further. The main page consists of the following:
Hourly Rate of Alerts: The number of threats received per hour per severity. This is updated every ten minutes.
SEV 2 Attacks over time: This is the rate of elevated attacks over time. This is refreshed every ten minutes. The arrow adjusts to reflect if the rate is increasing, steady, or decreasing over time.
SEV 2 Attacks over time: This is the rate of elevated attacks over time. This is refreshed every ten minutes. The arrow adjusts to reflect if the rate is increasing, steady, or decreasing over time.
Top 5 - Highest Threat WiFi Network
Top 5 - Highest threat Carrier
Global Cluster map: This map geographically plots where the events are located. The larger the circle, the greater number of events displayed.
Choropleth Map - Events by Country
Events by Severity
Events by Mobile Platform
Global Threats page: This provides the threat details via Carrier and other global aspects.
Top Events page: This page details the threats by platform and also attack types.
Note
At this time, the Custom Search and Custom Reports pages are not yet functional.
Export/Syslog push in the Mobile Security console UI
In Mobile Security console, you can set up a Syslog or Kinesis push within the UI under the Manage page and Integrations and Data Export tab. Mobile Security console allows you to set up data exports for numerous destination types.
For threats, you specify:
The filter level, which is the severity level for reported threats with these values:
Critical Only
Elevated and Above
Low and Above
Normal and Above
If you want detailed forensics information in your threat information.
When a security event is generated from one of the devices, the event information, including relevant forensics, is uploaded into the Mobile Security console. This data is pushed to the environment. The data is presented in JSON format, which provides an easy way for any SIEM system to be able to digest the event and associated forensics.