Exploring the Quarantine page
The Quarantine page provides detailed information regarding the quarantined files from all endpoints you manage. For more information about the quarantined items detected on Exchange mail servers, refer to Exchange Protection.
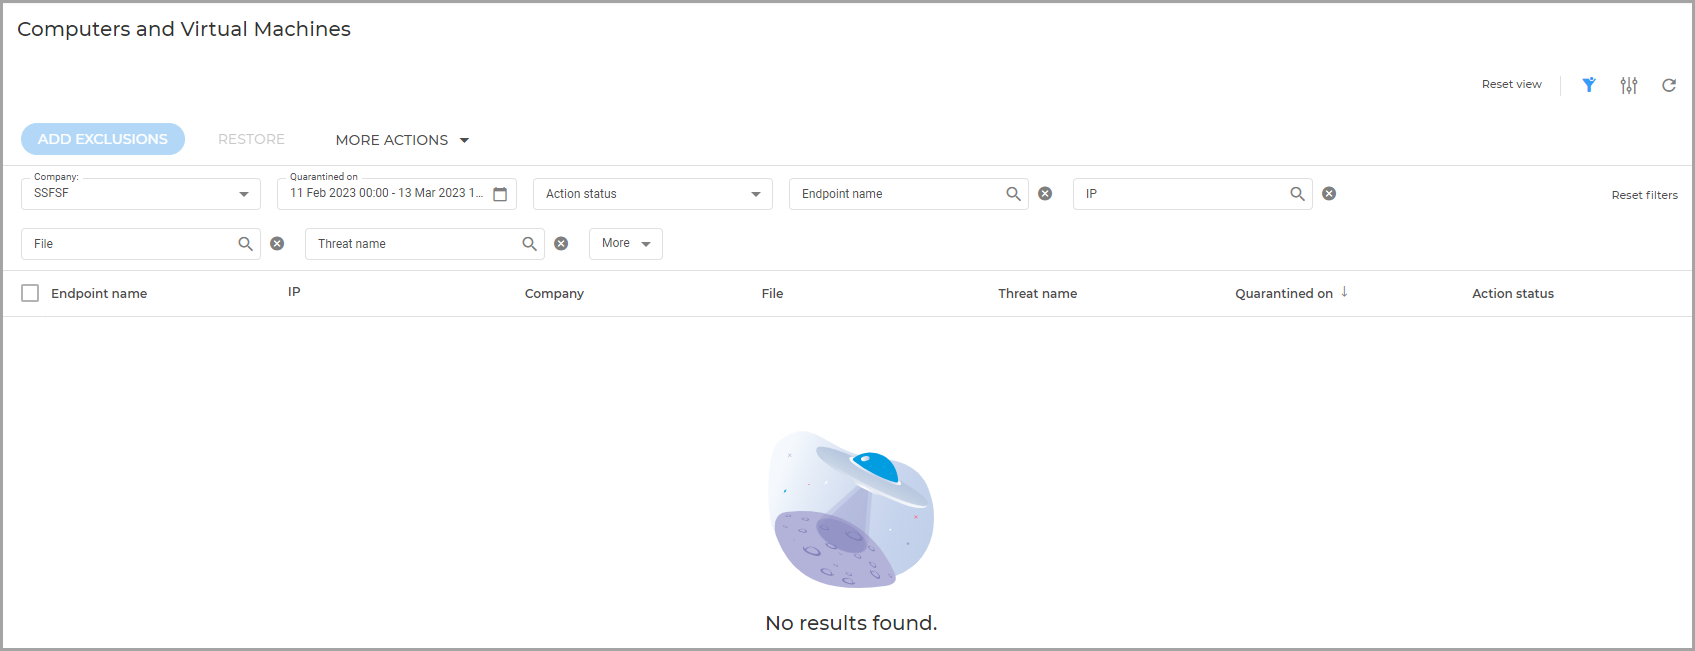
The Computers and Virtual Machines quarantine page contains information about items detected directly in the endpoints file system.
Information about quarantined files is displayed in a table. Depending on the number of managed endpoints and the infection degree, the Quarantine table can include a large number of entries. The table can span several pages (by default, only 20 entries are displayed per page).
To move through the pages, use the navigation buttons at the bottom of the table. To change the number of entries displayed on a page, select an option from the menu next to the navigation buttons.
For better visibility of the data you are interested in, you can use the available filters. For example, you can search for a specific threat detected in the network by typing the threat name in the search bar of the filter. You can also click the column headers to sort data by a specific column.
To view quarantined files from all the companies you directly manage or from all companies to which you have access, use the specific entries under the Company filter: All directly managed and All recursively.
To manage the Quarantine page, use the options available on the upper right side. You can reset filters to default values or hide them completely, adjust columns, reset, refresh, or adjust the table to a compact view.
The quarantine table provides you with the following information:
The name of the endpoint on which the threat was detected.
The company where the endpoint is located.
IP of the endpoint on which the threat was detected.
Path to the infected or suspicious file on the endpoint where it was detected.
Name given to the malware threat by the Bitdefender security researchers.
The date and time when the file was quarantined.
The status of the action requested to be taken on the quarantined file.
The size of the quarantined file.
The hash of the quarantined file.
The name of the technology that performed the detection. You can view manually quarantined files and files detected by multiple Antimalware and Integrity Monitoring technologies.
To make sure the latest information is being displayed, click the  Refresh button on the lower right side of the table. This may be needed when you spend more time on the page.