Security Telemetry
Security Telemetry provides access to raw security events generated on your endpoints, allowing you to forward endpoint activity to a SIEM solution for monitoring, investigation, and custom correlation.
The security agent collects the selected event types from the endpoints to which the policy applies and sends them directly to the configured SIEM solution as they occur. To ensure optimal performance and data footprint, the agents send only events relevant to the security of your network. Certain events can generate a significant volume of logs and may increase associated SIEM costs.
The Security Telemetry functionality requires the following:
A license that provides access to the EDR feature.
Managed endpoints that have the BEST agent installed with the EDR Sensor module enabled and a policy applied with the EDR feature.
Additional configuration for some event types. For these specific requirements, refer to Security Telemetry events sent to SIEM.
Event types
Events are grouped into categories based on the type of endpoint activity they record. You can select the events based on the endpoint activity you want to monitor.
The following categories and event types are available:
The Process category provides visibility into process execution and interactions, helping reconstruct activity sequences and identify abnormal behavior. It includes the following events:
Create, Terminate, and Injection.
The File category provides insight into how files are created, accessed, modified, moved, and deleted. It includes the following events:
Create, Delete, Modify, Move, and Read.
The Registry category monitors changes to Windows Registry keys and values, helping identify system modifications. It includes the following events:
Create key, Delete key, Modify value, and Delete value
The Network category helps you track endpoint network activity, helping identify connections and domain name resolution requests. It includes the following events:
Connection and DNS query.
Note
Events in this category require additional configuration.
The Shell and script activity category provides insight into commands and scripts processed on the endpoint, helping investigate command-based and fileless activity. It includes the following events:
Command Prompt command, PowerShell command, PowerShell script block logging, and AMSI buffer.
Note
Some events in this category require additional configuration.
The Service category includes service creation, configuration, and status changes that may affect endpoint operation or persistence. It includes the following events:
Added, Change status, and Modify.
Note
Some events in this category require additional configuration.
The Scheduled task category provides visibility into scheduled task activity, helping investigate automated execution and persistence mechanisms. It includes the following events:
Create, Delete, and Modify.
Note
Some events in this category require additional configuration.
The Account management and authentication category monitors local account changes, authentication attempts, and user sessions, helping investigate unauthorized access or account misuse. It includes the following events:
Create local account, Delete local account, Logon, Logon failed, Logout, and Settings changed.
Note
Some events in this category require additional configuration.
The BITS job activity category provides visibility into Background Intelligent Transfer Service (BITS) jobs, which applications can use to transfer files in the background. It includes the following events:
Add file, Create, and Delete.
The WMI activity category provides visibility into Windows Management Instrumentation (WMI) operations that may be used for system management, execution, or persistence. It includes the following events:
Execution method, New activity, and New binding.
The Device and driver category tracks hardware device activity and driver modules that interact with the operating system. It includes the following events:
Driver module load, Hardware mount, and Hardware unmount.
The BEST agent category monitors requests to uninstall the security agent from an endpoint. It includes the following events:
Agent uninstall request.
The Audit policy category monitors changes to Windows audit policy settings on the endpoint. It includes the following events:
Change Windows audit policy
For more information about each event, including requirements, descriptions, and available fields, refer to Security Telemetry events sent to SIEM.
Splunk configuration
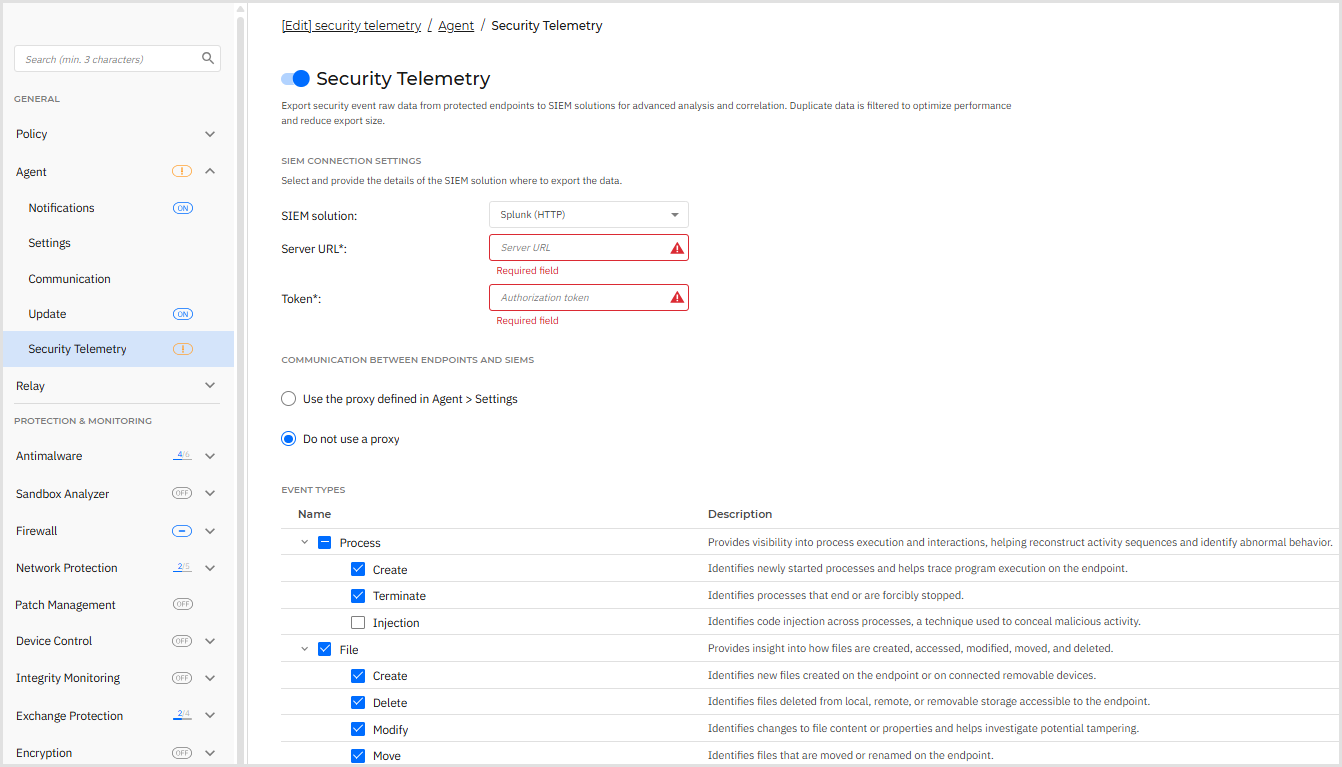
The security agent sends this information in a standard industry format (JSON), directly to the SIEM solution (Splunk).
To send security events from the target endpoints to the SIEM solution, configure the policy as follows:
Click the toggle to enable Security Telemetry.
Select the SIEM solution you are going to connect to.
Provide the URL of the SIEM server.
Warning
HTTPS protocol with TLS 1.2 or higher is required, otherwise, event submission will fail.
In case a security certificate validation error occurs, but you still want to use the SIEM server against the error, select Bypass collector CA validation in Control Center. The option is visible only when the certificate cannot be validated.
Note
Such error occurs if GravityZone cannot check the SSL certificate of the HTTP collector against a Certificate Authority or the DNS of the server. For example, when your HTTP collector uses a self-signed security certificate.
Enter the authorization token that secures the connection.
Select the types of events you want to send from the endpoint to the SIEM.
Under the Communication between endpoints and SIEM, choose whether to use a proxy server.
The agent uses for communication with the SIEM the same proxy server as for the communication with GravityZone.
You can check its settings in the General > Settings section.
Once the policy is applied on endpoints, the agent starts sending events as they occur to the configured SIEM server.
Syslog (JSON) configuration
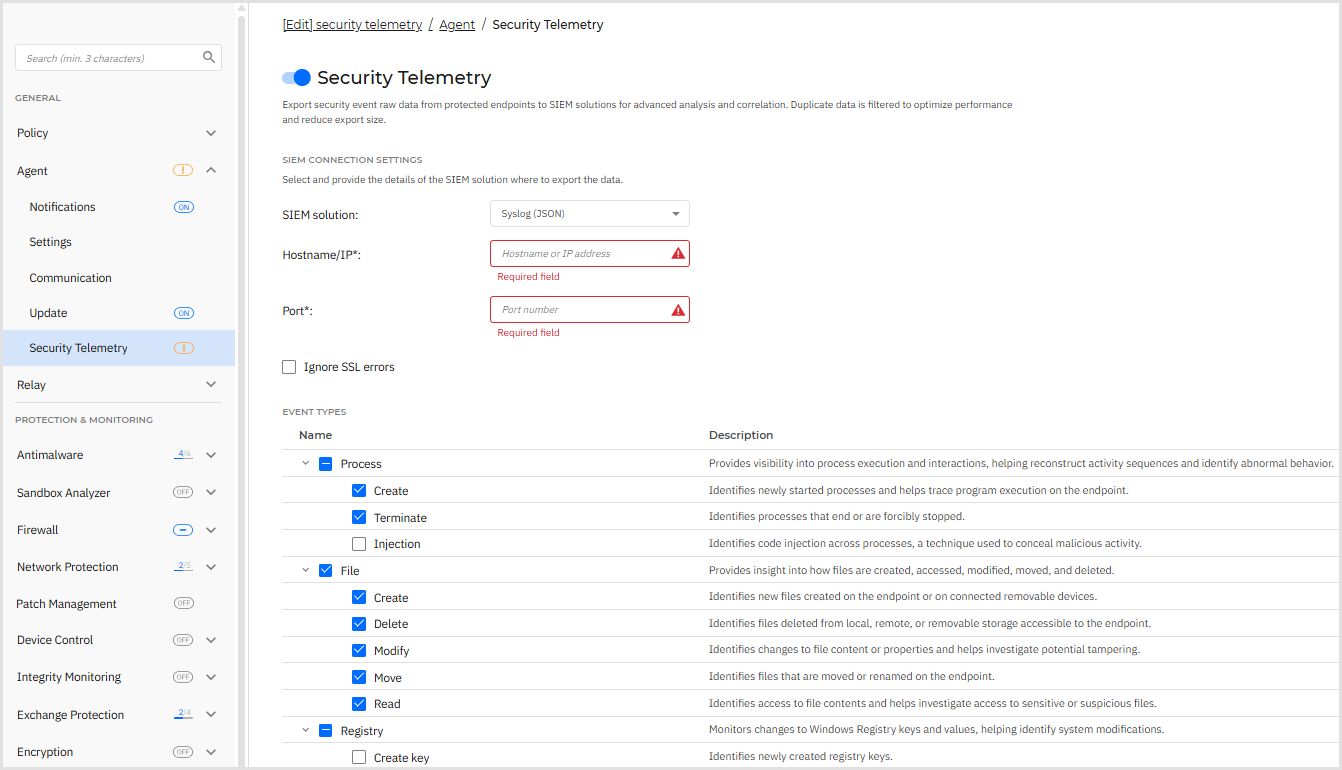
The security agent sends this information in a standard industry format (JSON), directly to the SIEM solution.
Note
For messages to be delivered, the target server needs to have Transport Layer Security (TLS) enabled.
To send security events from the target endpoints to the SIEM solution, configure the policy as follows:
Click the toggle to enable Security Telemetry.
Under SIEM solution select Syslog (JSON).
Under Hostname/IP type in the hostname or IP of the syslog server.
Note
The IP address or hostname must be reachable by endpoints.
Enter the port used by endpoints to connect to the syslog server under Port.
Optional: Select Ignore SSL errors if you want to ignore security certificate validation errors. These errors can occur whenGravityZone cannot check the SSL certificate of the HTTP collector against a Certificate Authority or the DNS of the server. For example, when your HTTP collector uses a self-signed security certificate. Note that a security certificate is still required for the TLS connection.
Select the types of events you want to send from the endpoint to the SIEM.
Important
If you have the GravityZone EDR Data Retention Add-on and Security Telemetry is enabled in the endpoint policy, you can now view Raw Events in the Historical Search page. This functionality is available even if you are using the MDR service, forwarding telemetry events to a third-party SIEM, or both.
However, for BEST endpoint versions earlier than 7.9.13.423, which do not support sending telemetry to multiple destinations, event forwarding is limited to a single target, based on a predefined priority. In these cases, GravityZone applies a fallback mechanism:
If you have the EDR Data Retention Add-on, use MDR and forward events to a third-party SIEM, events will be sent to MDR.
If you use MDR and forward events to a third-party SIEM, events will be sent to MDR.
If you use MDR and have the EDR Data Retention Add-on, events will also be sent to MDR.
If you have the EDR Data Retention Add-on and forward events to a third-party SIEM, events will be sent to EDR Data Retention.