Sensor installation and integration
XDR makes use of these sensors:
The Incidents Sensor - Correlates events and generate organization-level incidents.
The Incidents Sensor continuously monitors endpoint activity such as running processes, network connections, registry changes, and user behavior. This metadata is being collected, reported and processed by machine learning algorithms and prevention technologies that detect suspicious activity on the system, and generate Incidents.
The Network Sensor -Enriches the pool of events correlated by XDR with network data
The Network Sensor continuously listens to network traffic, collecting events from all endpoints in your environment, pre-processing and pre-filtering them, and sending the metadata to GravityZone's Security Analytics engine, thus enriching the context of extended incidents generated by GravityZone.
Other sensors - These sensors integrate data from all the cloud and local service platforms your company uses.
In the Sensors Management tab of the Configuration menu you can set up and manage additional sensors that process data from any major cloud or local service platform your company uses. XDR interprets this data and correlates it with events from the Incidents and Network sensors to enhance the level of details in extended incidents and deliver more accurate detections.
Important
The Network Sensor, as well as the productivity, identity and cloud sensors available for integration in the Sensors Management area require a separate license key for activation.
You can find a step by step guide on how to integrate or install each sensor in this section of documentation.
Suggest a new sensor
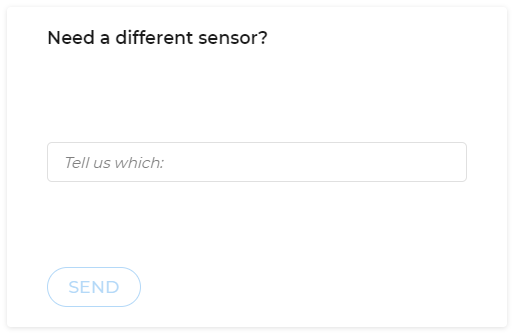
You can request a new sensor type in GravityZone Control Center by accessing Configuration > Sensors Management > Add new > Need a different sensor?
