Send security telemetry from GravityZone to Splunk Enterprise
Overview
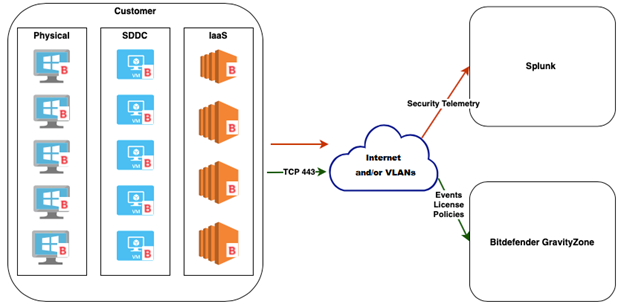
GravityZone provides security telemetry (also called “raw” or OS events) so that administrators can analyze it, save it, filter it, and build custom correlations using the Splunk Enterprise console.
This topic describes how you can forward such information from GravityZone to Splunk Enterprise v8. It provides the requirements and the configuration steps to enable the Bitdefender security telemetry to the SIEM.
The topic is intended for a technical audience, with knowledge of Window/Linux CLI and of security certificates.
GravityZone forwards security telemetry events to the SIEM through the Bitdefender Endpoint Security Tools (BEST) agent that is installed on the Windows endpoints. Bitdefender GravityZone only controls the activation, configuration, and validation of the event submission.
BEST can send the following security telemetry event types:
Process (create, terminate)
File (create, read, modify, move, delete)
Registry (create, delete key; modify, delete value)
User (logon, logout)
Network connection
Note
You can choose which types of events to send by configuring the policies in GravityZone Control Center.
Prerequisites
For Bitdefender GravityZone:
The Security Telemetry option is available with the following product suites:
Bitdefender Cloud MSP Security with ATS and EDR add-ons
GravityZone Business Security Enterprise
Note
For GravityZone on-premises, version 6.21.1-1 or newer is needed.
BEST for Windows security agent, version 6.6.25.362 or newer
BEST for Linux security agent, version 7.1.0.200110 or newer
GravityZone user privileges: Company Administrator or Custom user with Manage Network and Manage Company rights
For Splunk Enterprise:
Splunk Enterprise 8.1.3 or newer
Splunk user privileges: Admin account
Access to management console
Access to HTTP Event Collector (default port: 8088, but you can also use port 443)
Configuration
To receive endpoint security telemetry events from GravityZone to Splunk Enterprise, you must ensure a trusted connection between the managed endpoint and Splunk. Through this channel, events are forwarded in real-time, and you can query the raw data.
For this purpose, you can use security certificates issued by a public Certificate Authority (CA), or you can use self-signed certificates. If using certificates issued by a CA for Splunk, skip to the Configure GravityZonesection in this topic. If using self-signed certificates, follow the entire configuration procedure.
Configure Splunk
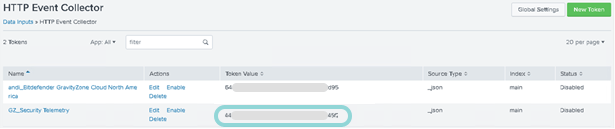
You can use an existing Splunk HTTP Event Collector or create a new dedicated collector responsible for receiving the Bitdefender security telemetry data from agents.
The HTTP Event Collector must have the following configuration:
Sourcetype: _json
Index: main
Global Settings: enableSSL=1
By default, BEST will send the security telemetry data to Splunk HTTP Collector via port 8088.
Use the following guide to generate the self-signed certificates needed to secure your Splunk installation: How to Self Sign Certificates for Splunk Enterprise.
The output consists of the following files:
myServerCertificate.pemmyServerPrivateKey.keymyCACertificate.pem
Concatenate all files previously obtained into a single cert file.
Command for Windows:
type myServerCertificate.pem myServerPrivateKey.key myCACertificate.pem > myNewServerCertificate.pem
Command for Linux:
cat myServerCertificate.pem myServerPrivateKey.key myCACertificate.pem > myNewServerCertificate.pem
Once created, the contents of the
myNewServerCertificate.pemfile should contain, in the following order:The server certificate:
myServerCertificate.pemThe private key:
myServerPrivateKey.keyThe certificate authority public key:
myCACertificate.pem
Instruct Splunk to use new certificate schema:
Move all the certs obtained in the above process to a new Splunk folder.
For example:
$SPLUNK_HOME/etc/auth/mycerts/Instruct Splunk about securing the HTTP collector section with the new certs by editing
$SPLUNK_HOME/etc/apps/splunk_httpinput/local/inputs.conf.The
inputs.conffile should contain the following items:[http] disabled=0 index=main enableSSL = 1 serverCert = $SPLUNK_HOME/etc/auth/mycerts/myNewServerCertificate.pem sslPassword = password_used_when_creating_the_certificate
Note
You can write the password in clear when first editing
inputs.conf. Splunk will automatically encode this field after you restart it.Restart Splunk from GUI.
Note
Alternatively, you can restart only the splunkd service:
$SPLUNK_HOME/bin/splunk restart splunkdExtract
myCACertificate.pemfrom Splunk directory ($SPLUNK_HOME/etc/auth/mycerts/) and import it into the endpoints that will submit security telemetry.The certificate must be converted to a format in which it can be imported by Windows endpoints in
Certificates (Local computer) > Trusted Root Certification Authorities > Certificates.Verify that the imported certificate is valid:
Access
https://:8088/services/collectorwith a browser from the endpoint that already have it in their certificate store.Note
If you have trouble with this link, there other variations available in the Send data to HTTP Event Collector on Splunk Cloud Platform section of this article.
Click the lock icon to check the state of the certificate.
Configure GravityZone
Using the token value for the new HTTP Event Collector, connect to GravityZone Control Center.
Click the policy applied to the managed endpoints to edit it.
Navigate to General > Security Telemetry.
Select the Security Telemetry option.
Under the SIEM Connection Settings section, enter the SIEM server URL and the Splunk token from the newly generated HTTP Event Collector.
The Splunk server URL should have this format:
https://:8088/services/collector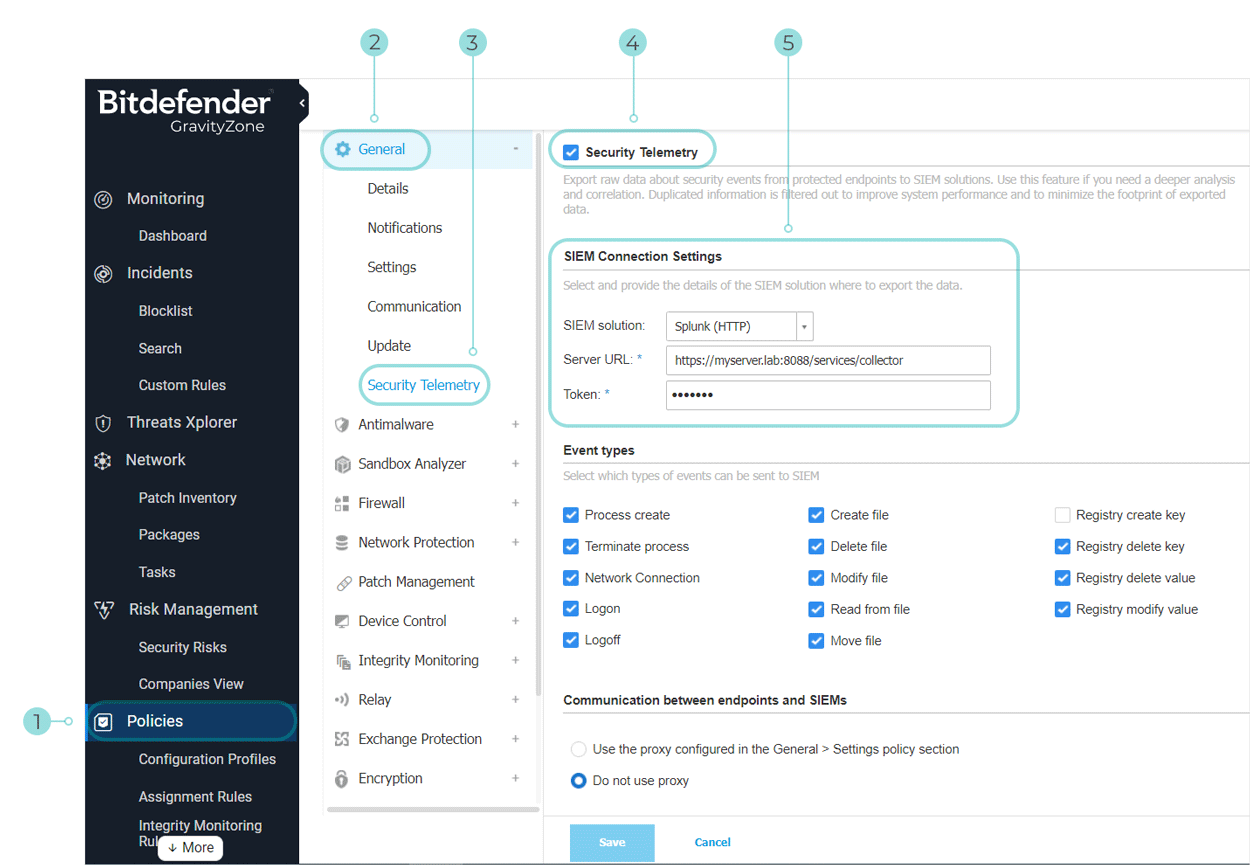
If using self-signed certificates, select Bypass validation of the SSL certificate on HTTP collector.
By default, Control Center checks the server URL and validates the certificates on the server against a public CA. With self-signed certificates, Control Center will return an error and communication between Control Center and the HTTP collector will not be established unless you select this option.
Important
This option applies only to the communication between the HTTP collector and GravityZone console, not the endpoints.
Control Center is responsible for policy enforcement, collector settings and event selection.
Click Save.
Note
For more information on configuring the Security Telemetry section of a policy, refer to this KB article.
Test the configuration
To validate the configuration:
Log in to GravityZone Control Center.
Go to the Network page from the left side menu.
Select an endpoint that was set to send security telemetry data.
The endpoint details page opens.
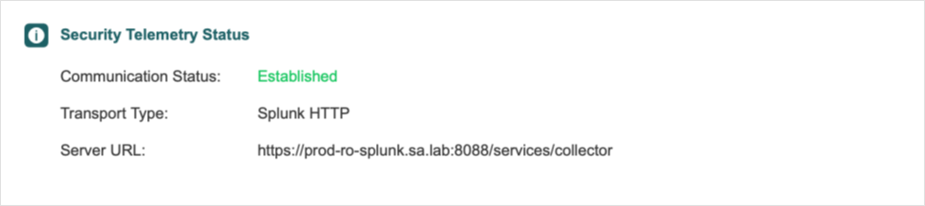
Check the Security Telemetry Status section under the Protection tab. Communication status should be Established.
The Security Telemetry events will be forwarded from the managed endpoint where BEST is installed directly to Splunk Enterprise 8. You can review and investigate alerts by searching the raw data and aggregating different fields.