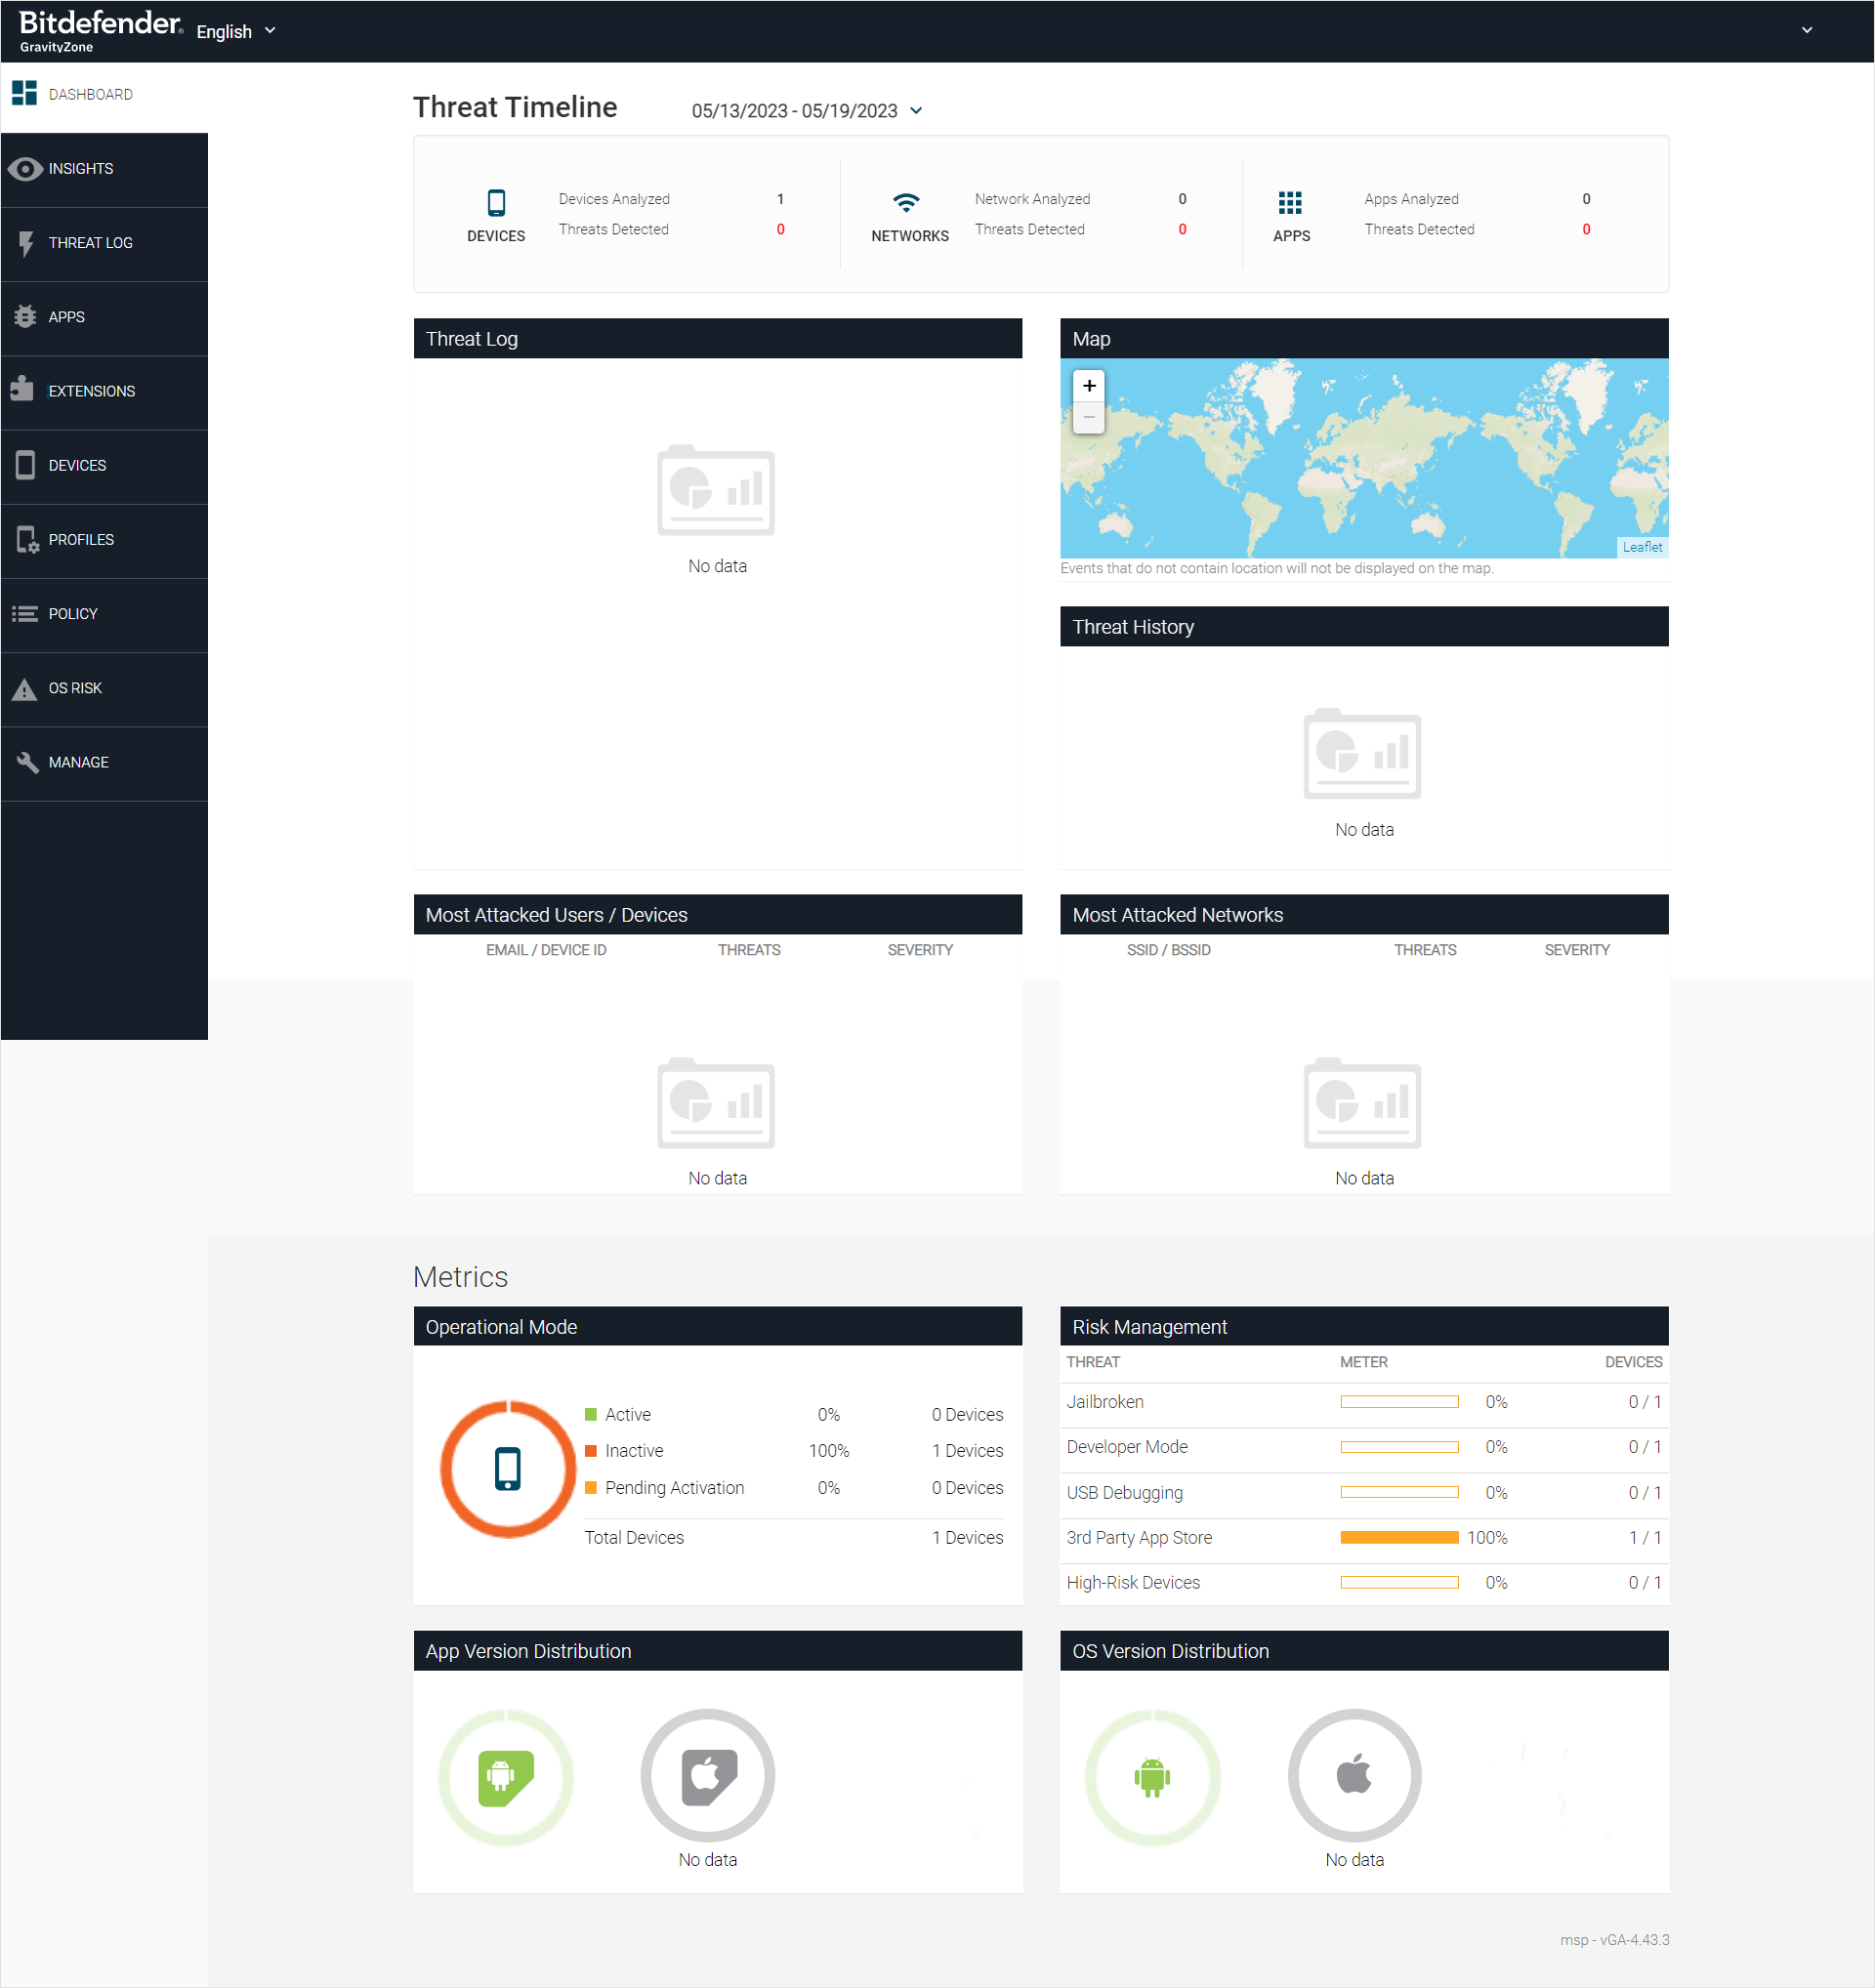
Using the Dashboard
The Dashboard page provides a single view of the protected devices, security intelligence, and events, regardless of their group.
It consists of several sections that provide a snapshot of the inventory status and security intelligence.
The top of the dashboard provides the ability to change the time frame of events and data, which automatically updates the events and other data points on the dashboard.
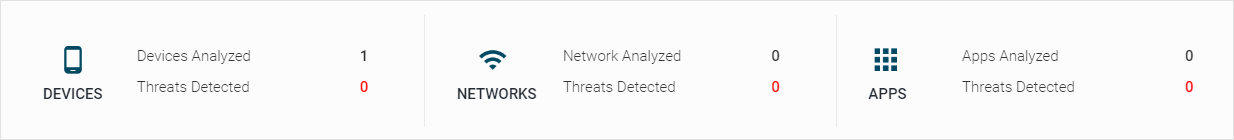
Activity Widget
The dashboard Activity widget provides administrators with an overview of system activity over a configurable time range. It includes counts for devices, networks, and apps, and threats detected over the selected time range.
Clicking the Threats Detected value in red leads to the Threat Log page with target events filtered in.
Threat Log Widget
The Dashboard page contains the Threat Log, which presents all security events that are currently pending.
The administrator can perform various actions on an event by selecting the three vertical dots icon located on the right-hand side of the event.
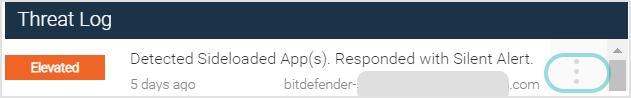
The available options include marking the event as Approved, Fixed, or initiating an MDM Action.
In the event that an action is designated as Approved or Fixed, it is required that the user provides a written explanation detailing the rationale behind said action. The Dashboard Threat Log exclusively displays threats that are classified as Pending.
Upon marking an event as Approved or Fixed, it is automatically removed from the dashboard.
Map Widget
The Map displays all events and their associated locations within the time frame chosen for the Dashboard, with an icon with a number representing the number of events at each location.
Threat History Widget
The Threat History graph displays events in a time frame separated by severity, with values for each data point listed. Severity levels are rated as Critical, Elevated, Normal, or Low.
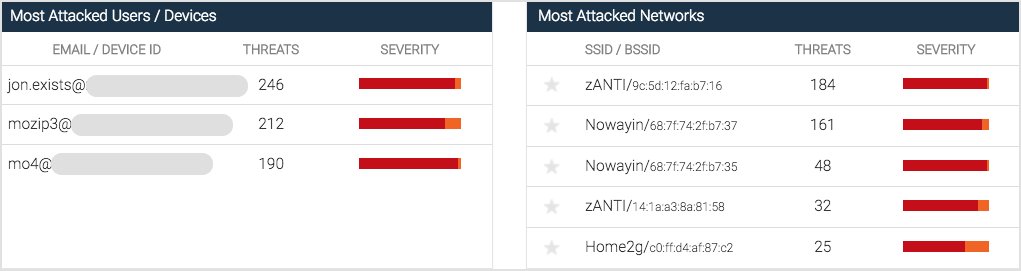
Most Attacked Information - Users, Devices and Networks
There are two additional sections in the dashboard:
Most Attacked Users/Devices
Most Attacked Networks
These sections provide intelligence on the top five users/devices attacked, and the top five networks attacked. The list dynamically updates per the time frame the user selects at the top of the Dashboard, and the user can click the Email/Device ID field in the Most Attacked Users/Devices section to access the events for this user in the Threat Log page.