Investigating Incidents
The Incidents section helps you filter, investigate and take actions on all security events detected by Incidents Sensor over a specific time interval.
This section contains the following features:
Incidents: view and investigate incidents.
Blocklist: manage blocked files from incidents.
Search: query the security events database.
Custom rules: create custom rules for exclusions or detections
Note
Availability and functioning of these features may differ depending on the license included in your current plan.
The Incidents page
The Incidents page provides a highly customizable grid that displays a list of EDR/XDR incidents generated for your managed companies.
This page contains the following areas:
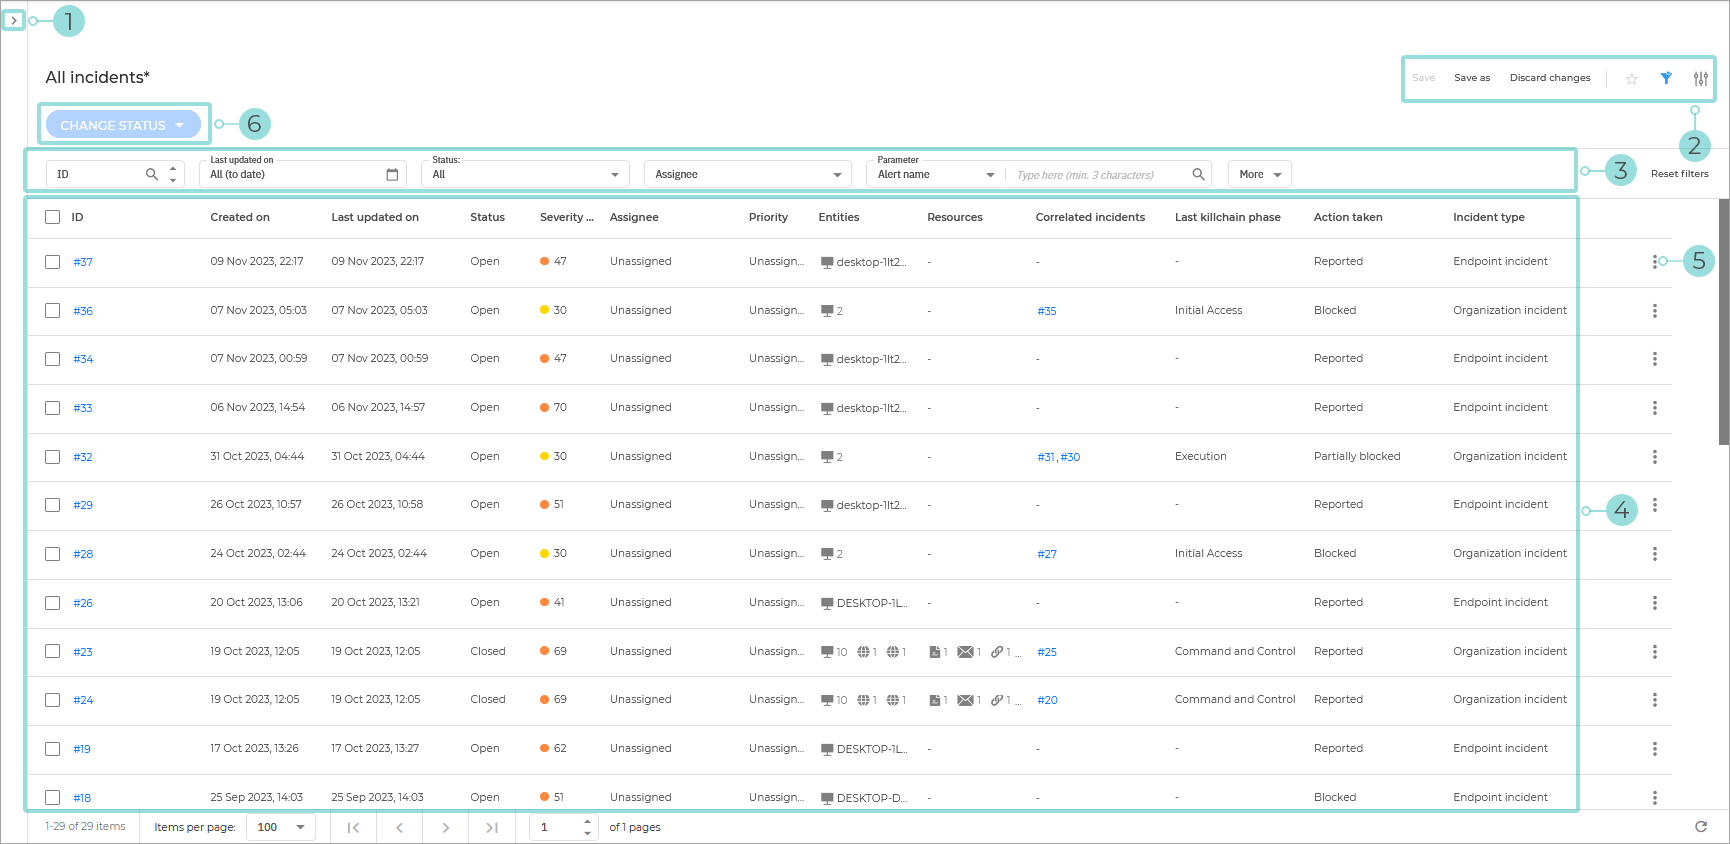
The Smart views panel toggle button. This feature allows you to customize, save, and switch between different loadouts of the Incidents page.
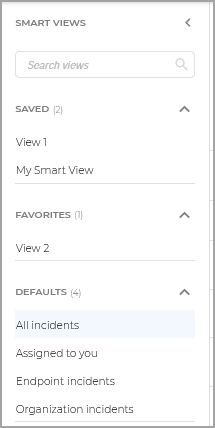
The panel has the following sections:
Search views - Use this search field to filter out the views displayed in the sections below, by name.
Saved - This section displays a list of all your saved views that have not been marked as favorites.
Favorites - All views marked as favorites are displayed under this section.
Defaults - This section displays the views that are available by default:
All incidents
Assigned to you
Endpoint incidents
Organization incidents
For any view in the Saved or Favorites category, you can click
 to Rename or Delete the view.
The View options menu. This section provides you with multiple functions for working with views:
Save: Use this option to save changes you make to a saved view.
Save as: allows you to save a modified view under a different name.
Discard changes: reverts the saved view to its original state.
Show demo incident or Hide demo incident: enables or disables the XDR demo mode feature.
Add to favorites: adds the view to the Favorites category.
Export view: exports your incidents grid as a CSV file.
Each entity or resource type is displayed in its separate column. These columns are dynamically generated: if no incidents involve a particular resource or entity type, the corresponding column will not be displayed.
Important
Up to 10,000 incidents can be exported at a time. We recommend adjusting the search options if your dataset exceeds this number.
Show or hide filters: hides or displays the filters menu.
Open Settings: displays the Settings panel.
You can use this panel to customize what columns are displayed in the view and enable or disable the Compact view.
The Filters section. You can use these options to customize the incidents that are displayed in the table below.
The following filters are currently available:
Filtering option
Details
ID
Type in a complete ID number for the incident you are looking for.
Only incidents with matching IDs are displayed.
Created on
Select a specific date range.
Only incidents that were created in that time period are displayed.
Last updated on
Select a specific date range.
Only incidents that were last updated in that time period are displayed.
Status
Select one or more of the following statuses:
All - Displays all incidents, regardless of their status.
Open - Displays incidents that have been recently generated and are yet to be investigated.
Investigating - Displays incidents currently under investigation.
Closed: False positive - Displays incidents that were investigated and confirmed to be false alarms.
Closed: Confirmed incident - Displays incidents that were confirmed as valid and are now closed following investigation.
Closed: Reviewed by MDR SOC - Displays incidents that were reviewed and closed by the MDR SOC.
Assignee
Select a GravityZone user from the list.
Only incidents assigned to the selected user are displayed.
Priority
Select one or more of the available priorities:
All
Unassigned
Low
Medium
High
Critical
Only incidents with the selected priorities are displayed.
Severity score
Drag the two toggles in the slide bar or type in specific values to specify a range for the Severity score.
The Severity score is a number between 10 and 100, indicating how potentially dangerous a security event is. The higher the score, the more certain the event is dangerous. It provides context based on the attack indicators and ATT&CK Techniques, if applicable.
Only incidents with severity scores between the selected values are displayed.
Company
Select a company from the list of all managed companies with valid XDR licenses.
Only incidents originating from the selected company are displayed.
Entities
Select one or more network entities from the available list. Only incidents with entities that exactly match at least one selected value are displayed.
Tip
The options list is dynamically generated from entities found in your incidents. To add a custom entity as a reusable filter:
Enter the desired value.
Select its checkbox.
Click Apply.
When reopening the filter, the custom value is visible in the list. It is temporary and can be used to create smart views for monitoring future incidents involving that entity. The value is cleared on page refresh, when applying filters that exclude it, or when navigating away, and must be added again if needed.
Actions taken
Select one or more of the following options:
All
Reported
Blocked
Partially blocked
Only incidents with the selected actions assigned are displayed.
Correlated incidents
Type in a complete ID number for the child correlated incident you are looking for.
The parent correlated incident with matching IDs is displayed.
Resources
Select one or more resources from the available list. Only incidents with resources that exactly match at least one selected value are displayed.
Tip
The options list is dynamically generated from resources found in your incidents. To add a custom resource as a reusable filter:
Enter the desired value.
Select its checkbox.
Click Apply.
When reopening the filter, the custom value is visible in the list. It is temporary and can be used to create smart views for monitoring future incidents involving that resource. The value is cleared on page refresh, when applying filters that exclude it, or when navigating away, and must be added again if needed.
Last killchain phase
Select one or more of the available options. The filter provides a list of attack phases, based on the MITRE matrix.
Only incidents that involved attacks that ended in one of the selected phases are displayed.
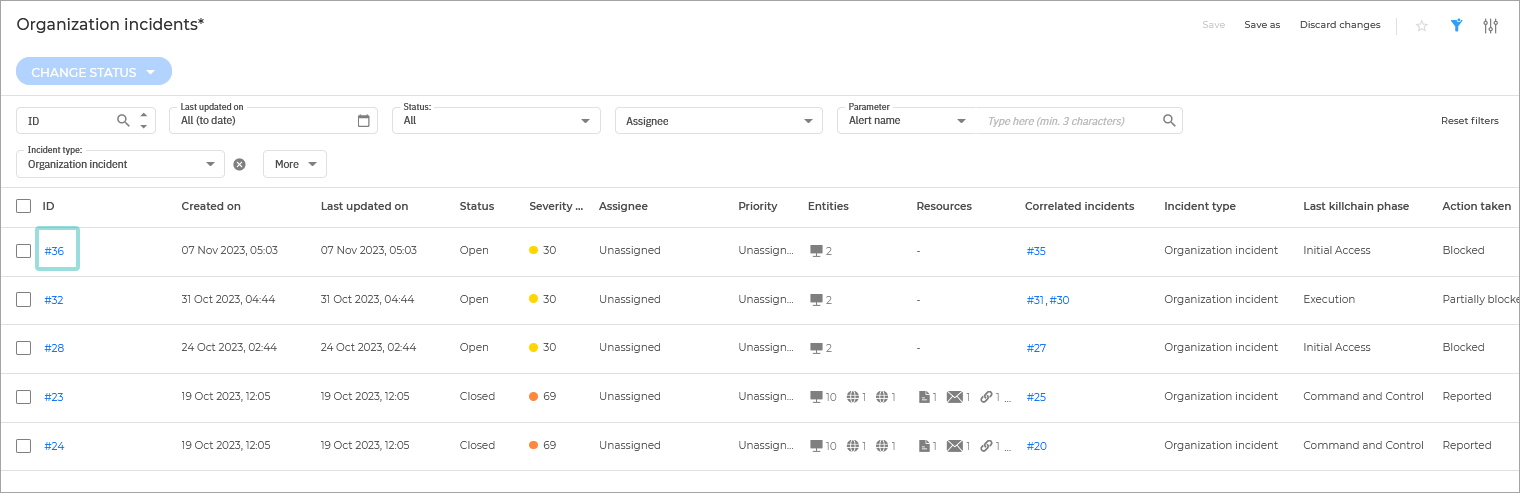
Incident type
Select between the available incident types. Selecting one of the below options will change the information displayed in the grid:
All - both Endpoint and Organization incidents are displayed in the grid.
Only Endpoint incidents that are not correlated to an XDR incident are displayed as a separate entry. All other Endpoint incidents are displayed under the Correlated Incidents column on the same line with the Organizational incident they are associated with.
Endpoint incidents - only Endpoint incidents are displayed when this is the only option selected. This includes both incidents that are associated with an Organization incidents and those that are not.
When both Endpoint incidents and Organization incidents options are checked, the Endpoint Incidents will be displayed under the Correlated incidents column if they are part of that Organization incident, if not, they will be displayed as a separate entry in the grid
Organization incidents - only organizational incidents are displayed in the grid.
If the Organization incident has any Endpoint incidents associated to it, they will be displayed under the Correlated Incidents column.
Parameter
Select between the available parameters:
Alert name - The name of the alert involved in the incident.
Att&ck technique - The name of the Mitre technique used in the incident.
Att&ck technique ID - The ID of the Mitre technique used in the attack.
Att&ck sub-technique - The name of the Mitre subtechnique used in the attack.
Att&ck sub-technique ID - The ID of the Mitre subtechnique ID used in the attack.
IP - The IP address involved in the incident.
MD5 - The md5 hash of the file involved in the incident.
SHA256 - The sha256 hash of the file involved in the incident.
Node name - The name of the node involved in the incident.
Username - The username involved in the incident.
File name - The name of the file involved in the incident.
File path - The path of a file involved in the incident.
URL - The URL involved in the incident.
MAC - The MAC address involved in the incident.
Email subject - The subject of the email involved in the incident.
Email address - The email address involved in the incident.
Process name - The name of the process involved in the incident.
Process path - The path of the process involved in the incident.
Process PID - The identifier of the process involved in the incident.
Registry key - The registry key involved in the incident.
Detection Rule ID - The ID of the Custom detection rule.
FQDN - The Fully Qualified Domain Name associated with at least one node involved in the incident.
This filter performs partial (substring) matching and returns incidents containing values that include the specified character sequence.
The Incidents table. The table displays all incidents not older than 90 days that conform to the currently applied filter.
The information available for each incident is displayed under the following columns:
ID - The ID of the incident.
Click on the incident number to display additional information regarding the incident.
Select the checkbox next to each incident number to include the incident when performing a Change status bulk action.
Created on - The date when the incident was created
Last updated on - The date when the incident was last updated.
Status - The status of the incident.
Assignee - The security analyst assigned to the incident.
Priority - The priority assigned to the incident.
Severity score - The severity score assigned to the incident.
Entities - A list of entities involved in the incident.
Click on any of the entities to display the Entities panel.
Actions taken - The action taken after investigating the incident.
Correlated incidents - The ID of child incidents correlated with the one displayed in the grid.
Resources - A list of related resources.
Click on any of the entities to display the Resources panel.
Last killchain phase - The last attack phase of the attack, based on the Mitre matrix.
Incident type - The type of the incident.
Note
More details regarding the information in each column are available type in the Filters section.
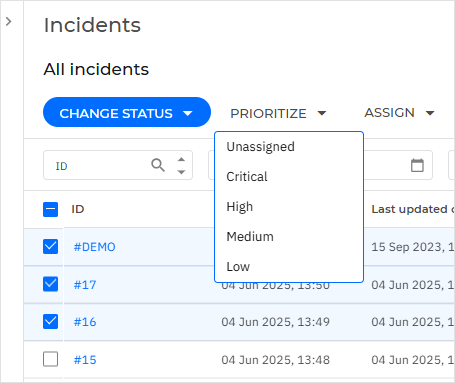
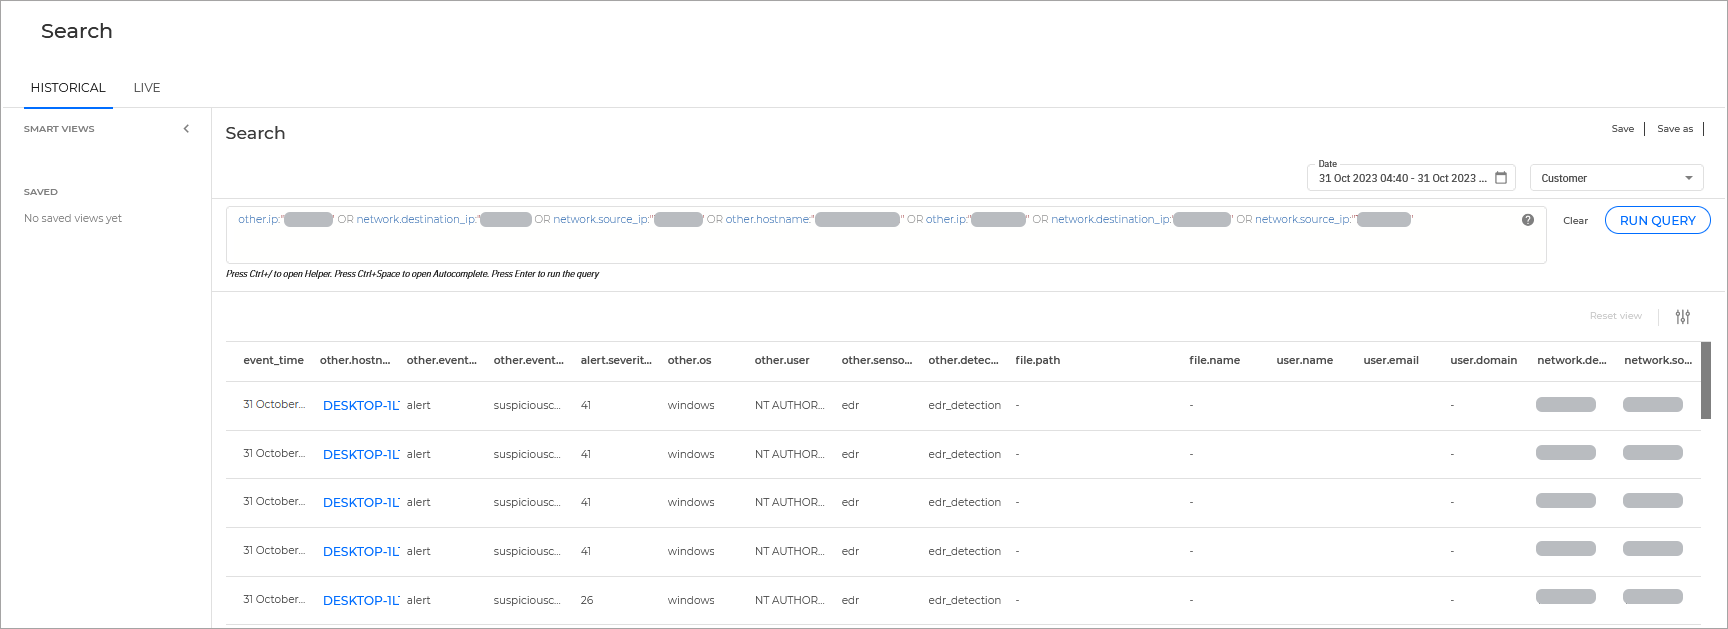
The Incident actions button. The button provides the following options:
View events and alerts - Selecting this option opens the Historical search page and automatically populates the search field with search parameters related to the incident.
Prioritize - Selecting this option opens a window where you can set the incident’s new priority, choose to apply the change to all correlated incidents, and provide a comment explaining the reason for the update. The priority change is applied once you click Change.
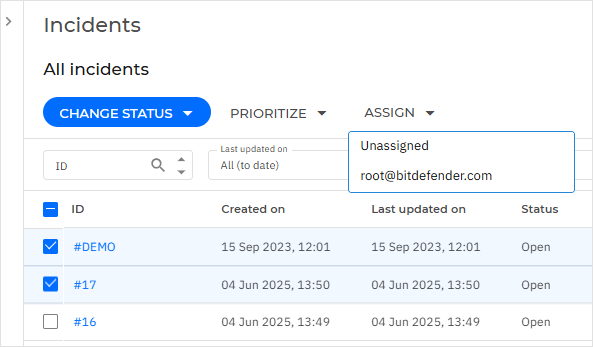
Assign - Selecting this option opens a window where you can set the incident’s new assignee, choose to apply the change to all correlated incidents, and provide a comment explaining the reason for the update. The assignee change is applied once you click Change.
The Change status button. Use this action to perform a bulk action on all selected incidents from the grid below.
A confirmation window is displayed.
If your selection includes Organization incidents, the window provides you with an Apply status change to all correlated incidents checkbox. Select it to also apply the new status to all incidents that are correlated to the ones you have selected.
You can use the Notes text box to comment on the reason for changing the incident status. The note will be added to the ones already added to the incident.
The Prioritize button. Use this action to assign a priority to all selected incidents from the grid below.
A confirmation window is displayed.
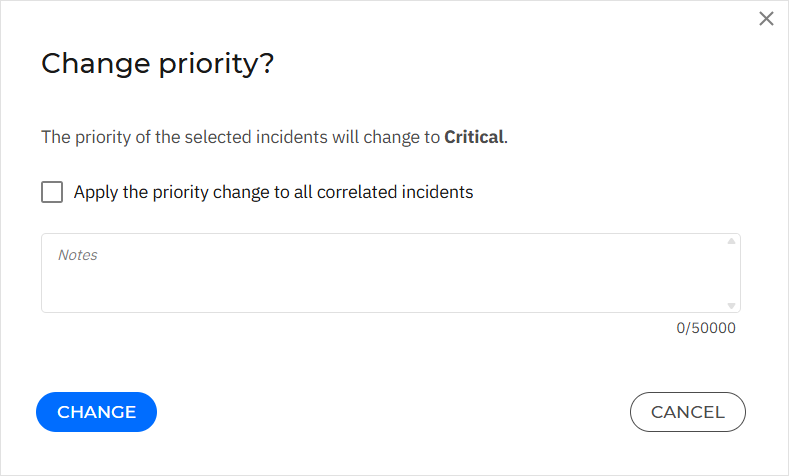
If your selection includes Organization incidents, the window provides you with an Apply the priority change to all correlated incidents checkbox. Select it to also apply the new priority to all incidents that are correlated to the ones you have selected.
You can use the Notes text box to leave a comment on the reason for changing the priority. The note will be added to the ones already added to the incident.
The Assign button. Use this action to assign an analyst to all selected incidents from the grid below.
A confirmation window is displayed.
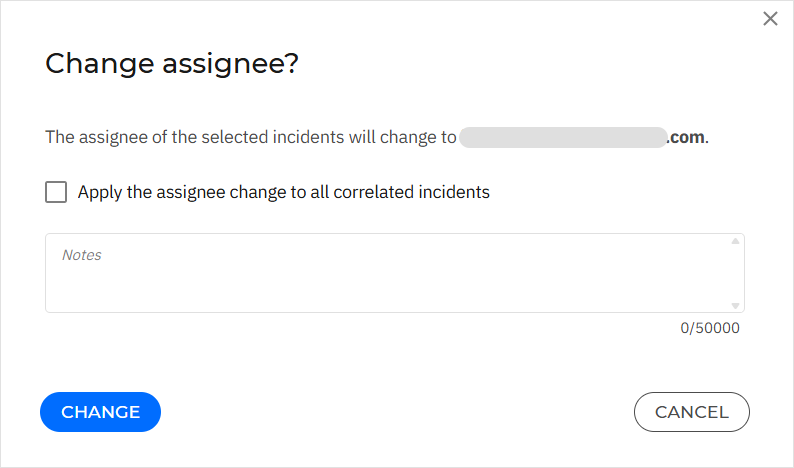
If your selection includes Organization incidents, the window provides you with an Apply the assignee change to all correlated incidents checkbox. Select it to also apply the new assignee to all incidents that are correlated to the ones you have selected.
You can use the Notes text box to leave a comment on the reason for changing the assignee. The note will be added to the ones already added to the incident.
Managing incidents
In the Incidents page, you can perform the following actions:
View incident details
To display additional information regarding any specific incident, use one of the methods below:
Display the incident details panel: Click anywhere on the row belonging to the incident you want to view (except the ID, Resources, and Entities columns):
For more information on the information included in the details panel, refer to The incident details panel.
Display the Organization incident overview: Click the Organization incident ID under the ID column. Incident information is listed in a rich card format, providing an overview of the incident, with information based on the selected filters.
Tip
Alternatively, you can copy the link to the incident by hovering your cursor to the right of the ID column and clicking on the Copy button when it appears.
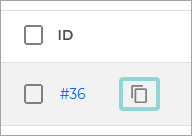
For more information, refer to Organization Incident Overview.
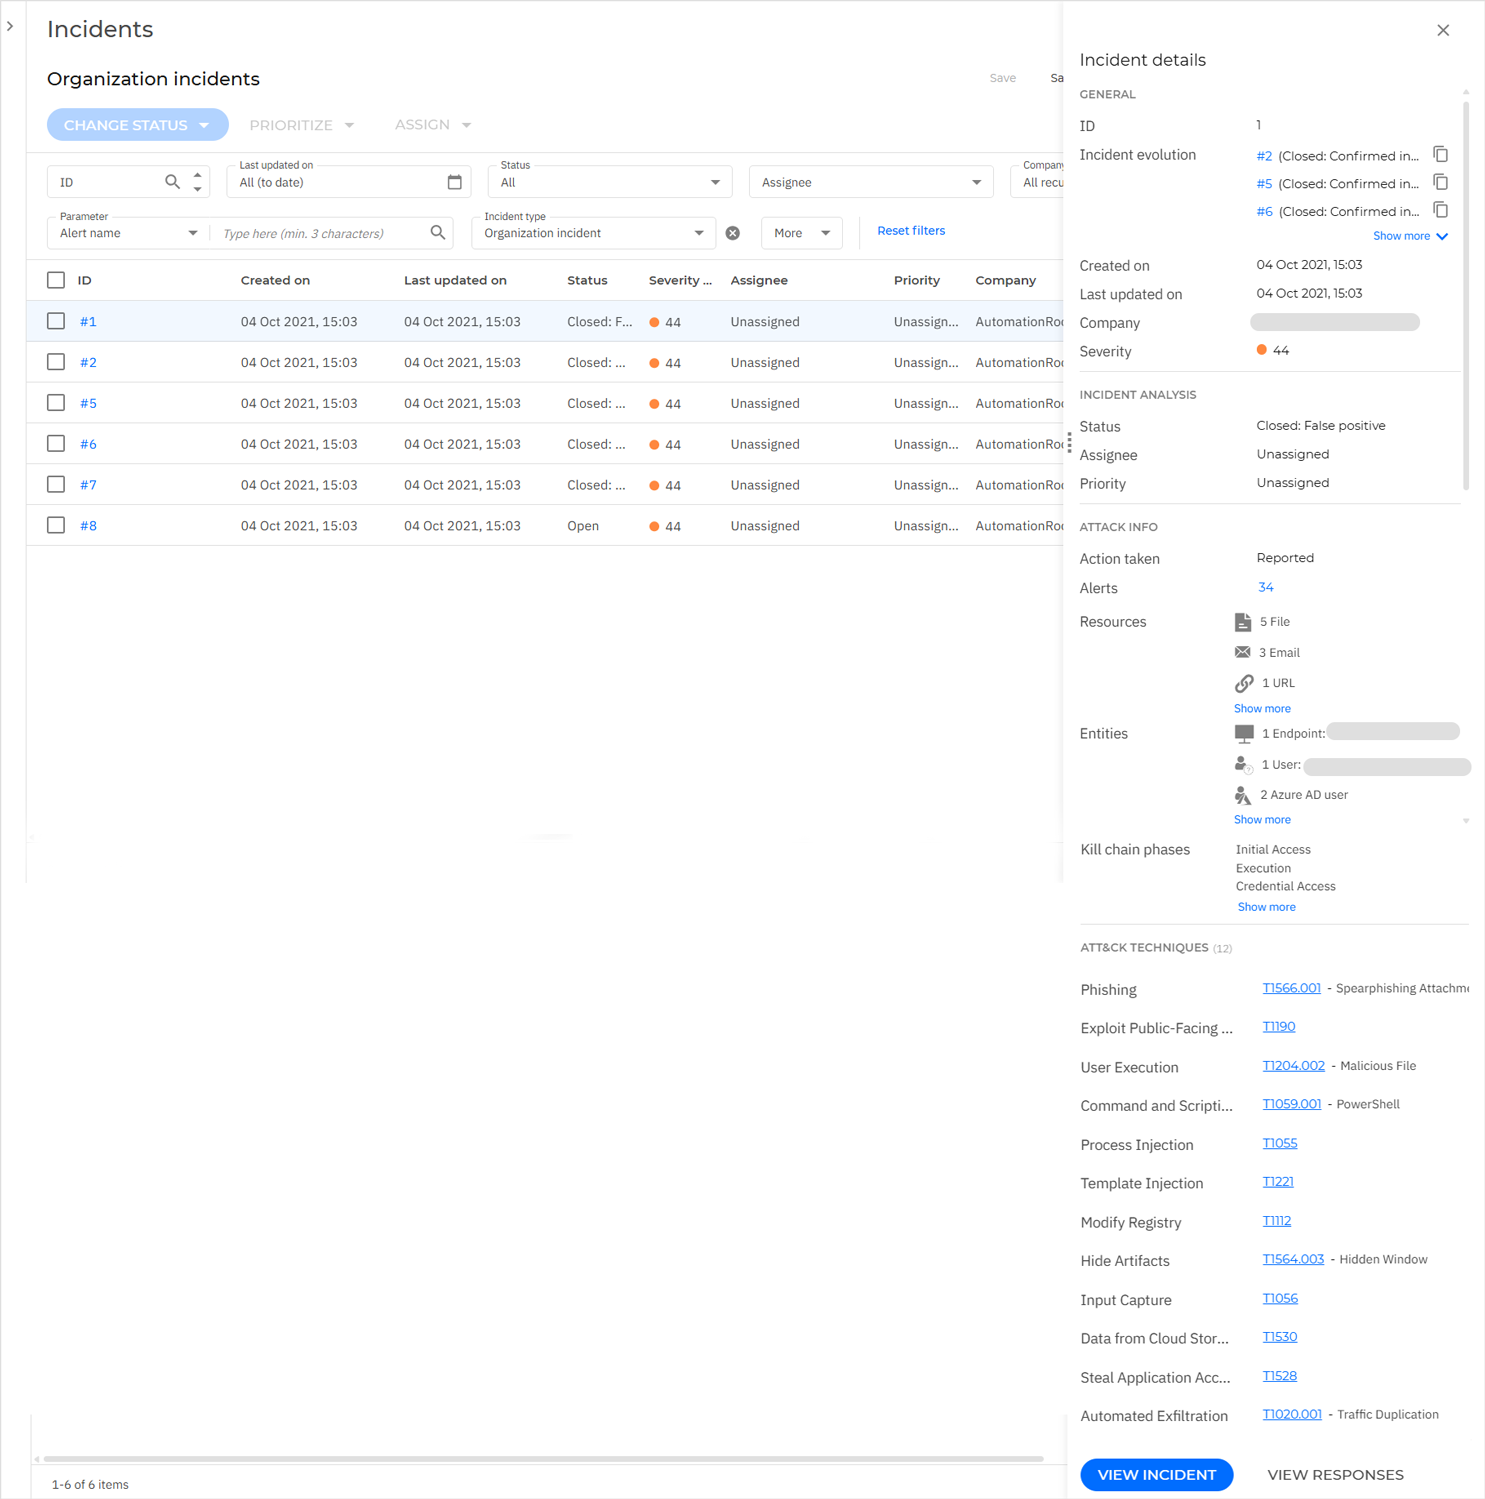
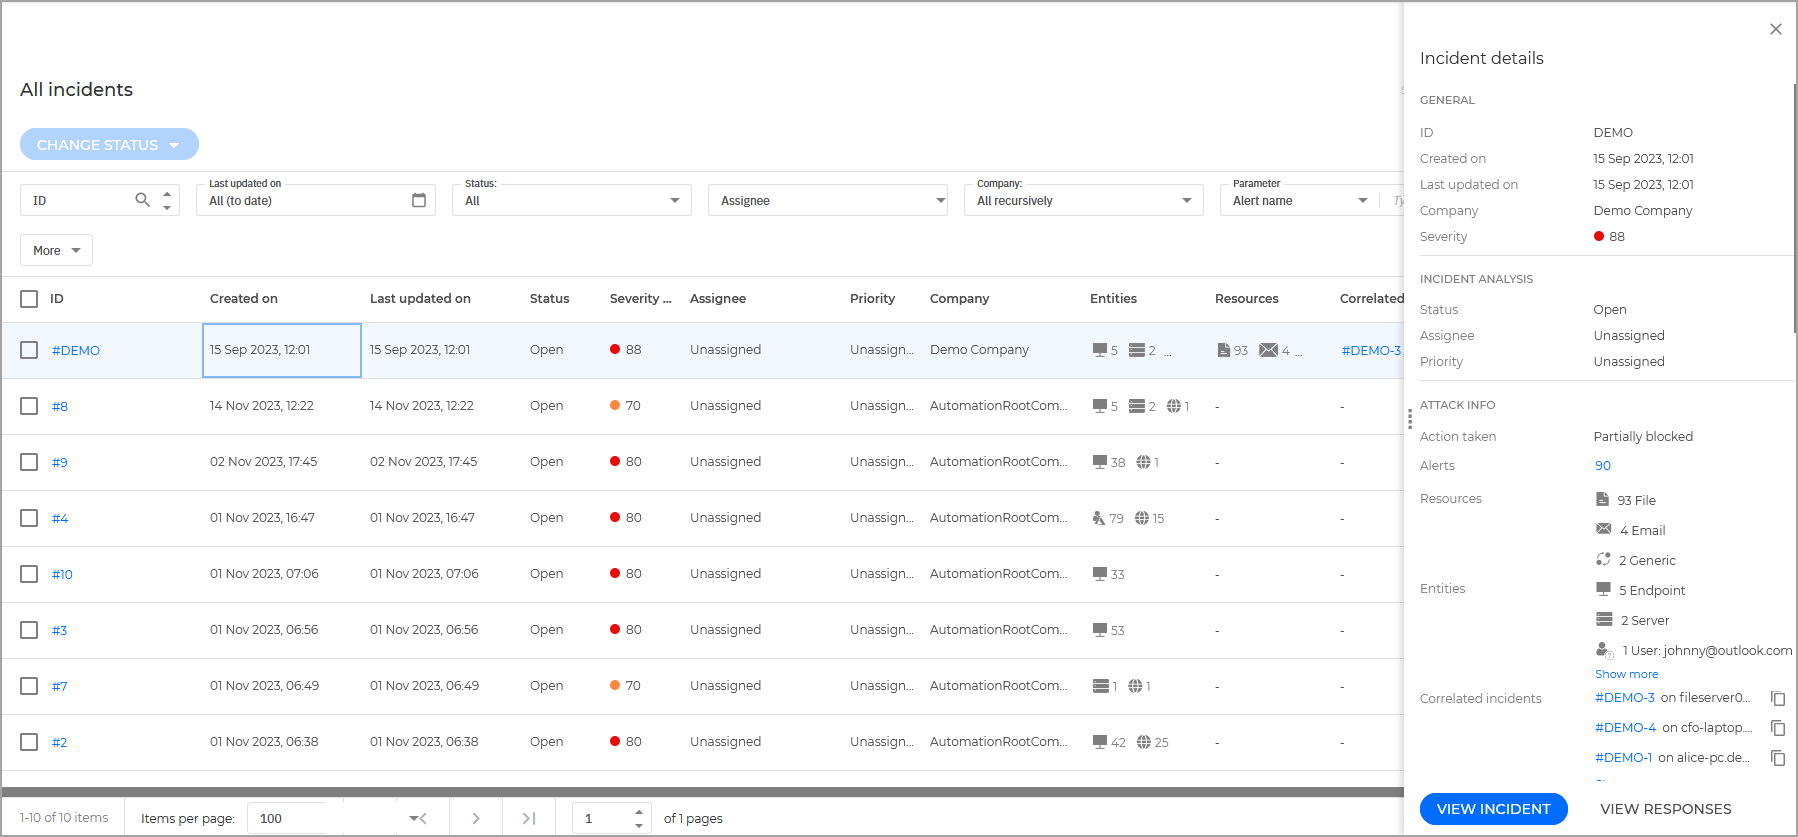
The incident details panel
The incident details panel provides a centralized view of all relevant information for a selected incident. It is structured into several sections for quick analysis and investigation:
General: Includes key identifiers such as the incident ID, the Incident evolution chain, and timestamps for creation and last update, along with company and severity details.
Important
The Incident evolution field is displayed only when the Create a separate incident when new activity is detected option is enabled in the Settings tab within the company edit workflow.
In this case, a new incident is generated whenever new activity is detected on a closed incident. The newly created incident remains open and is continuously updated with related activity until it is closed. If further activity is detected after this incident is closed, another new incident is created. All related incidents generated through this process form the Incident evolution chain.
Incident analysis: Summarizes the current state of the incident, including its status, assigned user, and priority.
Attack info: Includes:
Actions taken
The number of associated alerts
Only for Organization incidents:
The types of related resources, for example files, URLs, and emails, and the number of items in each category
Affected entities, including endpoints, users, or IPs
The stages of the attack
Only for Endpoint incidents:
Number of artifacts
The affected endpoint
The endpoint OS
ATT&CK techniques: Maps the incident to MITRE ATT&CK techniques, offering deeper insight into attacker behavior.
Detections: Provides a summary of the security events that contributed to the incident. Displays the Incident trigger along with the types of detections (for example, malicious URL, fraud, or phishing) associated with the incident.
Important
This section is displayed only for Endpoint incidents.
Changing the status of incidents
The investigation status helps you keep track of incidents that have already been investigated and marked as confirmed or false positive, incidents that are currently under investigation and open, or new incidents that have yet to be analyzed.
Follow these steps to change the status of one or multiple security events:
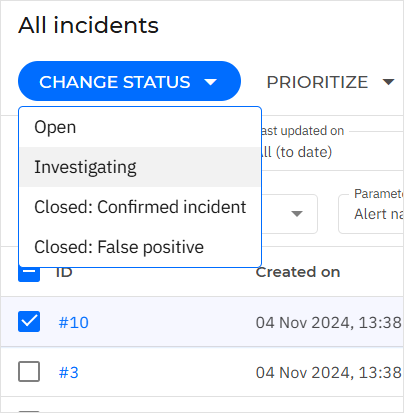
Select the checkboxes under the ID column of all the incidents you want to change the status for. Incidents will remain selected when you move between grid pages.
Tip
Clicking on the checkbox located in the table header row will select all the incidents displayed on the page.
Click the Change status button.
A list of available statuses is displayed:
Select one of the available statuses:
All - All incidents, regardless of their status.
Open - Incidents that have been recently generated and are yet to be investigated.
Investigating - Incidents currently under investigation.
Closed: False positive - Incidents that were investigated and confirmed to be false alarms.
Closed: Confirmed incident - Incidents that were confirmed as valid and are now closed following investigation.
Important
For incidents that belong to an Incident evolution chain, only the most recent incident can be reopened and reinvestigated.
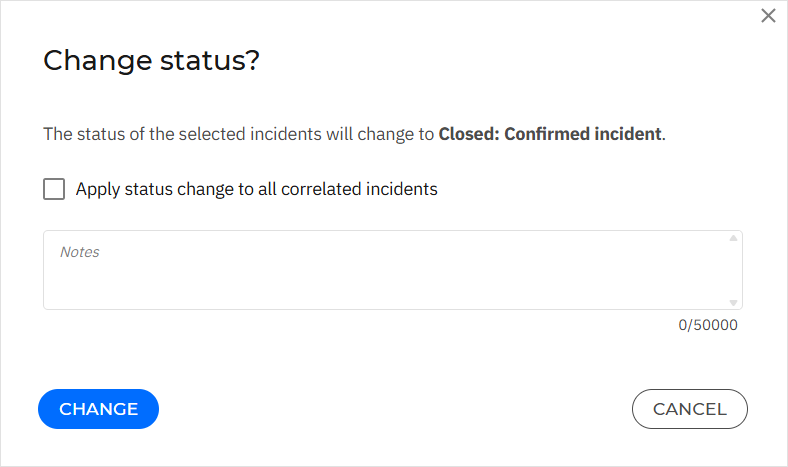
A confirmation window is displayed.
If your selection includes Organization incidents, the window provides you with an Apply status change to all correlated incidents checkbox. Select it to also apply the new status to all incidents that are correlated to the ones you have selected.
You can use the Notes text box to comment on the reason for changing the incident status. The note will be added to the ones already added to the incident.
Click Change to confirm the request.
View events and alerts related to an incident
You can directly search for all events and alerts related to an incident by following the steps below:
Click the menu button on the right side of the grid corresponding with the incident for which you want to get more information.
Select View events and alerts:
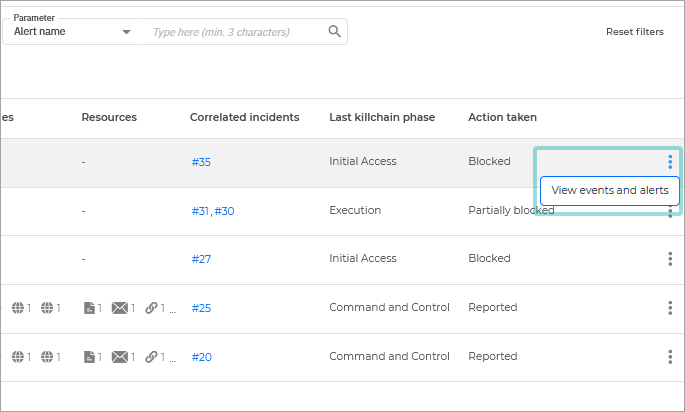
The Search page is opened in a new browser tab. The Query field is automatically populated with a string that contains information from the selected incident and the search results are displayed below.
Delete suspicious Gmail emails from an Incident
You can delete suspicious emails from the Organization incident view by using one of the methods below:
Tip
This feature is only available for integrated Google Workspace tenants.
From Organization Incident Alerts:
Open the Organization incident view for the incident where the email you want to delete was involved.
Go to the Alerts tab.
Click on the alert that was triggered by the email.
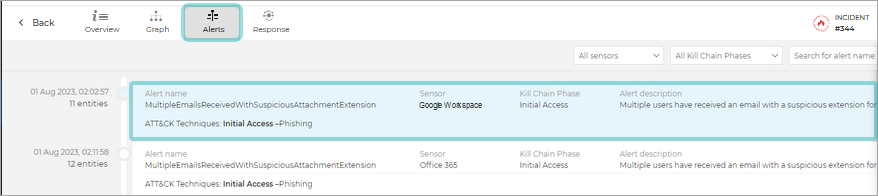
The alert's Extended Panel is displayed.
Scroll down to the Resources section of the panel and click the Delete email button:
From Organization Incident Alerts:
Open the Organization incident view for the incident where the email you want to delete was involved.
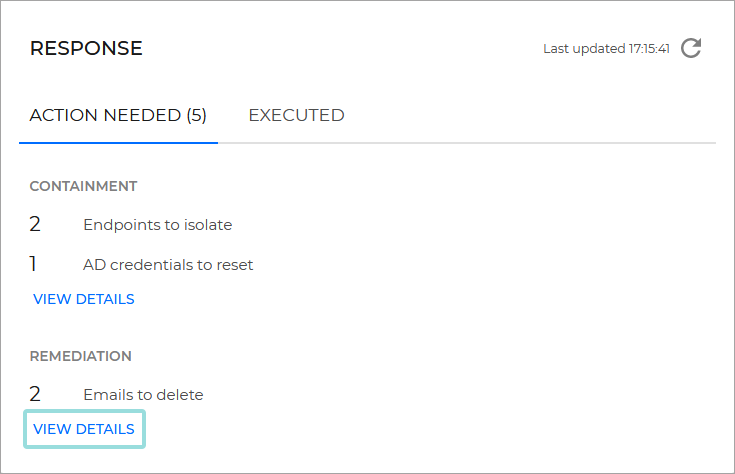
In the Overview tab, look for the Response section.
In the Action needed tab, under the Remediation section, click View details.
Note
The request will be recorded in GravityZone under User activity.
Take action on a Google account from an incident
You can take action on suspicious accounts from the Organization incident view by using one of the methods below. For the purpose of this guide, we will demonstrate how to deactivate an account:
Tip
This feature is only available for integrated Google Workspace tenants.
From Organization Incident Graph:
Open the Organization incident view for the incident where the email you want to delete was involved.
Go to the Graph tab.
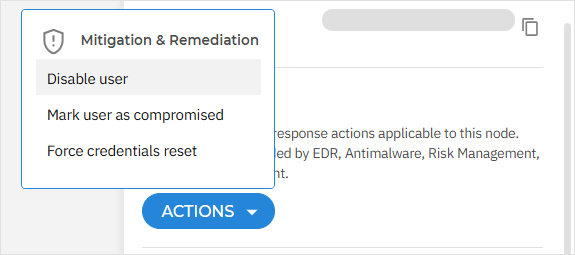
Click on the node that corresponds to the account you want to suspend:
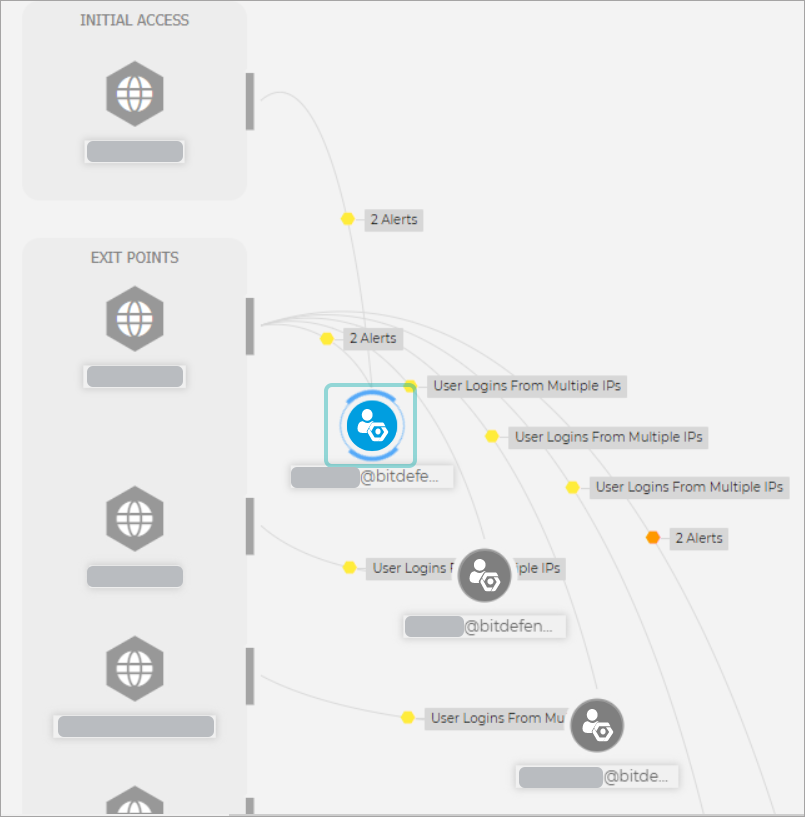
The Entity Details pane is displayed.
Under the Response actions section, click Actions, then Disable user.
From Organization Incident Alerts:
Open the Organization incident view for the incident where the email you want to delete was involved.
In the Overview tab, look for the Response section.
In the Action needed tab, under the Remediation section, click View details.
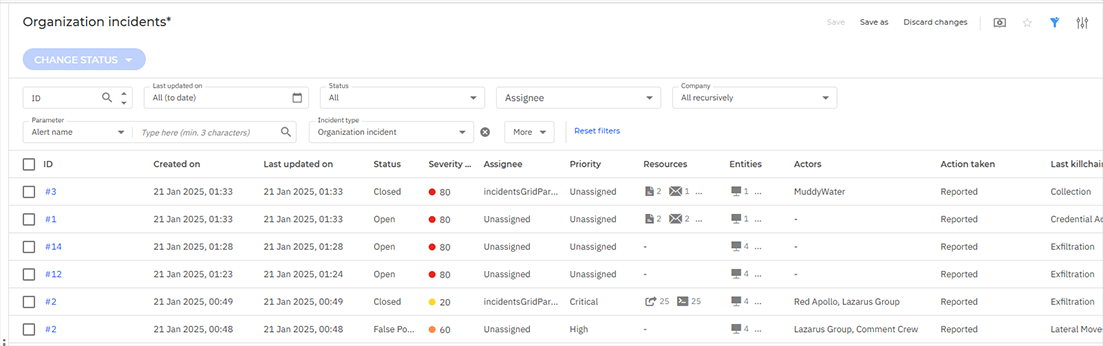
Investigating Organization Incidents
When selected from Smart views, in the Incidents page, the Organization incidents view displays all the complex incidents detected at global level in your environment, that may affect your entire network.
Each incident has a dedicated view that displays correlated events that have occurred in your environment, offering you a network-wide perspective on a potential staged attack.
Important
Availability of the XDR feature differs depending on the license included in your current plan.
In the Incidents page, click the Smart Views button.
The Smart views panel is displayed.
Select Organization incidents.
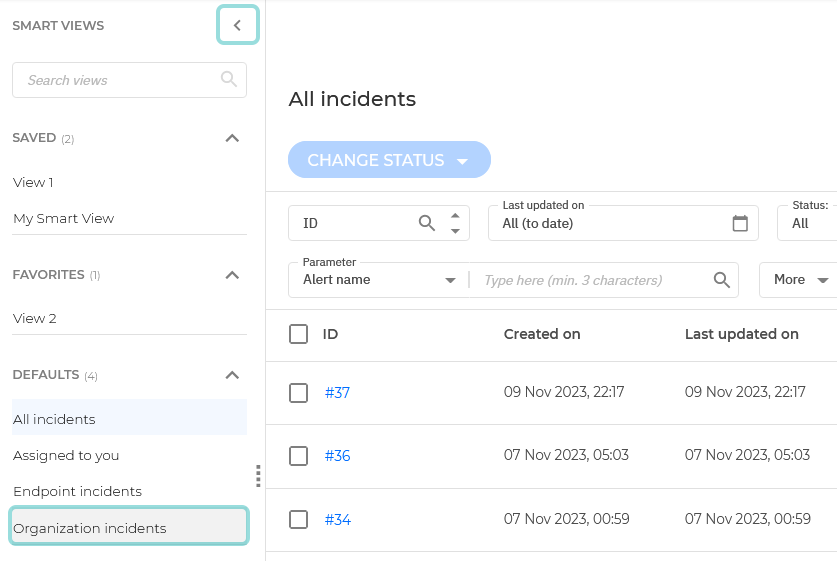
Now, only Organization incidents are displayed in the Incidents grid.
Identify the security event you want to analyze and click the link under the ID column.
You can also click the card of any incident to open its side panel and quickly analyze the incident indicators, or click the View incident button to start an in-depth analysis.
The incident opens by default in the Organization Incident Overview section.
In the Overview tab, you can see the root cause of the incident, as well as other insights on how the attack on your organization was performed. You can also see the techniques that were used, the company resources that were involved in the different stages of the kill chain.
The Response widget provides you with recommendations and actions you can take for immediate containment of the most imminent threats.
Consult the Actions needed tab to see what actions you need to take to eliminate or minimize active threats.
Consult the Actions executed tab to see what actions have already been taken to eliminate or minimize threats.
Note
Learn more about actions you can take to mitigate threats in the Response section.
Open the
 Graph view to see the graphic representation of the extended incident. Learn more about the Graph elements here.
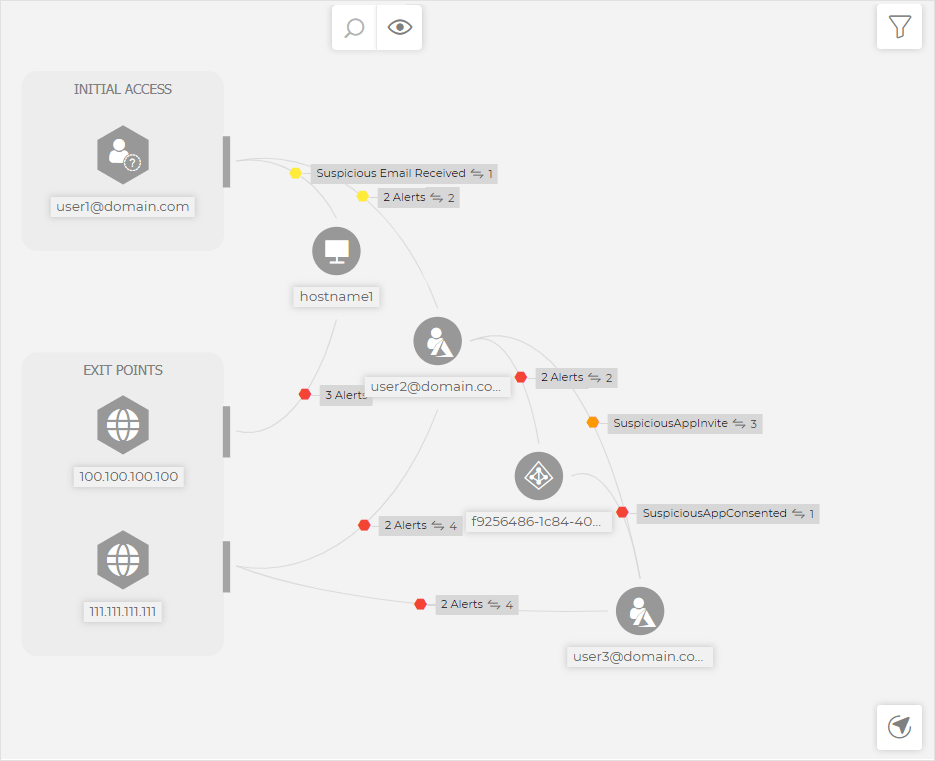
Optionally, use the Activity panel to display the sequence of events either by time or by the relevance in the attack kill-chain.
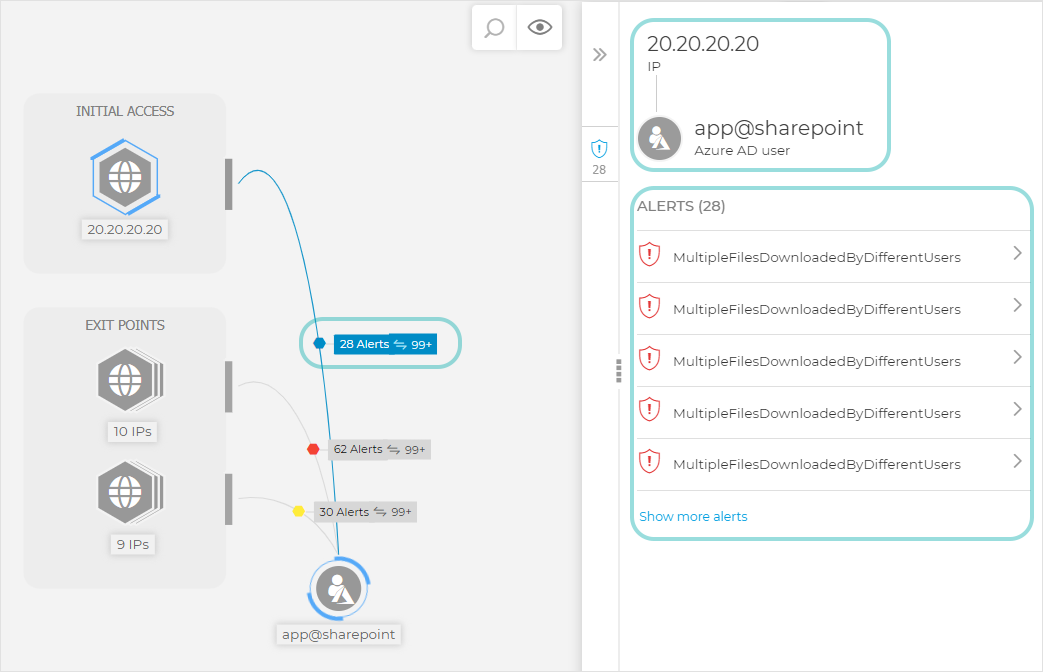
Select the interaction nodes with the highest severity, to analyze the details available in the side panel, including:
The source and target of the interaction.
The alerts that have spawned during this process and a summary of associated resources.
Important
Interactions marked red include alerts of high severity, and should be analyzed with priority.
If you want to dig deeper, open each alert to display additional information, including alert indicators, artifacts involved, interactions, resources used, attack techniques, and recommendations.
When viewing node details, you have several response action options. For details, refer to the 3. Node details panel section of the Organization Incident Graph page.
For compromised users, open the side panel of the user node and take actions such as Disable user, Force credentials reset, or Mark user as compromised. For details, refer to the 3. Node details panel section of the Organization Incident Graph page.
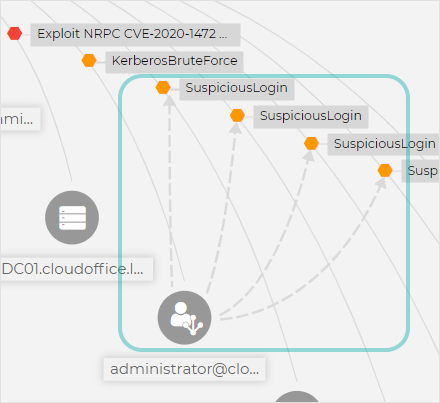
Important
Users who are involved in malicious or suspicious interactions are represented by a specific identity node, and dynamic dotted lines showing what other assets in your environment they may have compromised.
To continue with your investigation, navigate to the Alerts window to see every event correlated as part of the incident in detail.
Organization Incident Overview
The Overview page offers a synopsis of the extended incident you are investigating, displaying information about the severity of the incident, key security events that have occurred in your environment, as well as affected organization resources.
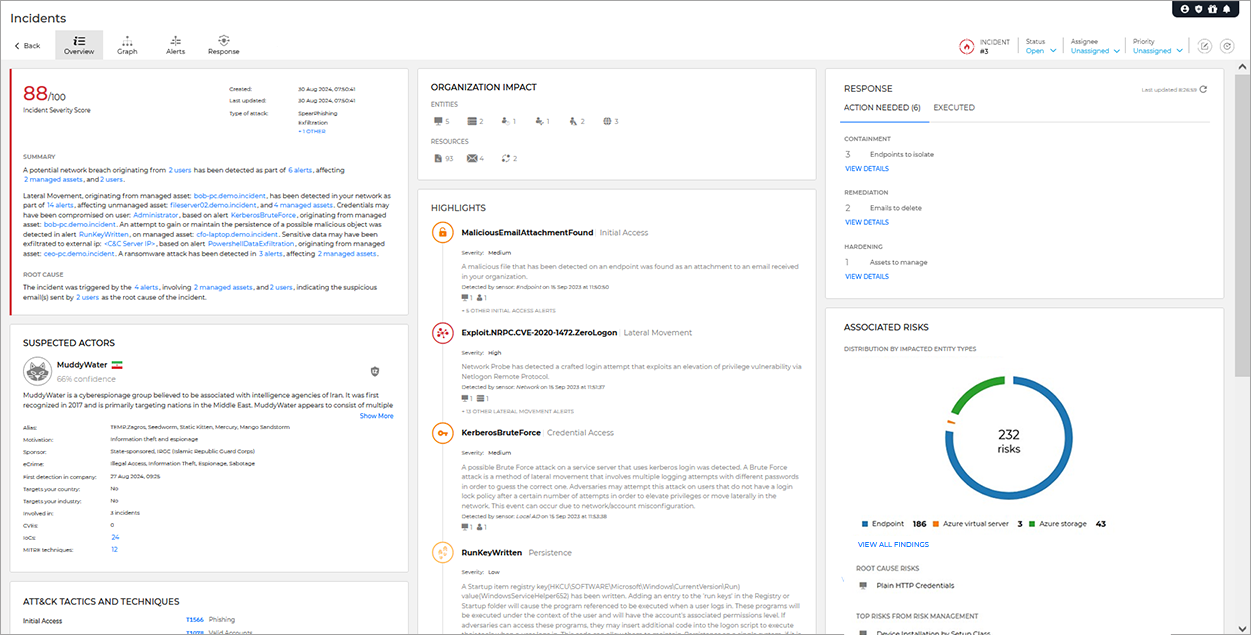
The data available on the investigated incident is grouped in the following categories:
Summary
The Summary outlines what happened in the incident, showing the Root cause analysis of the incident, as well as Initial Access, alerts triggered by ATT&CK tactics and techniques, and resources impacted by the incident.
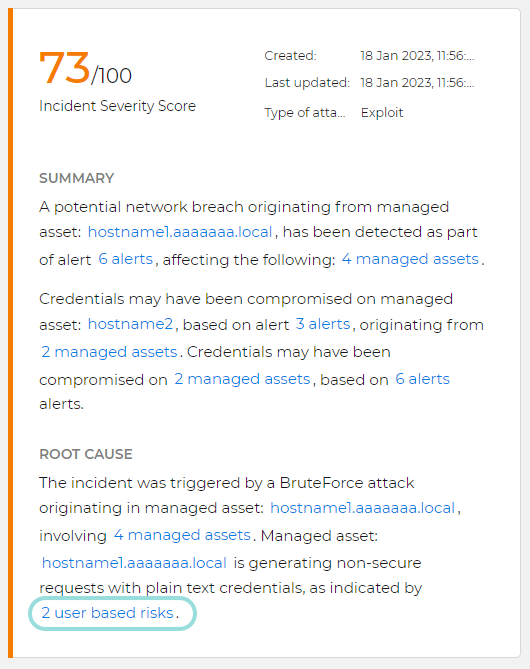
Click the blue-colored information to open detail panels that contain links to Risk Management or to the incident graph for further investigation.
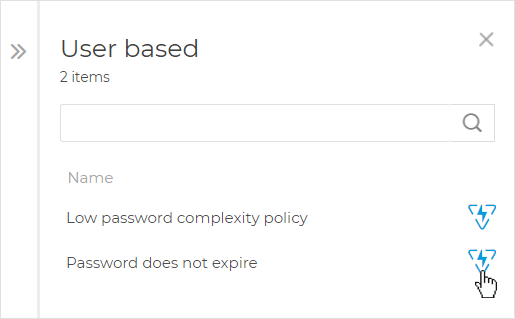
Note
If there is only one entity displayed, clicking it does not open its details panel, but instead it redirects you to Risk Management or to the incident graph.
Click Generate report to start downloading a detailed PDF report of the incident. This report can include up to 1,000 alerts and 300 nodes.
Important
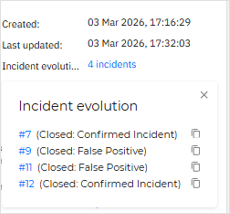
The Incident evolution field is also displayed in the top-right corner of the Summary card, but only when the Create a separate incident when new activity is detected option is enabled in the Settings tab within the company edit workflow.
To view details, click the number of incidents. A panel will open showing all related incidents, their status, and links that you can copy for each one:
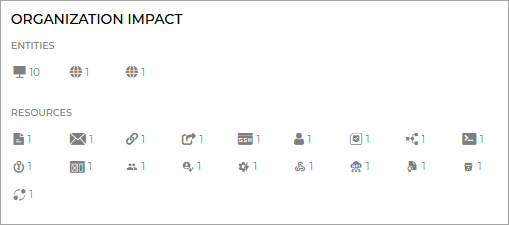
Organization Impact
The Organization Impact displays all the resources involved in the incident, including affected servers and endpoints, databases, compromising emails, and more.
Suspected actors
This section provides details for identifying and determining the individuals, groups, or organizations behind a cyber threat or attack.
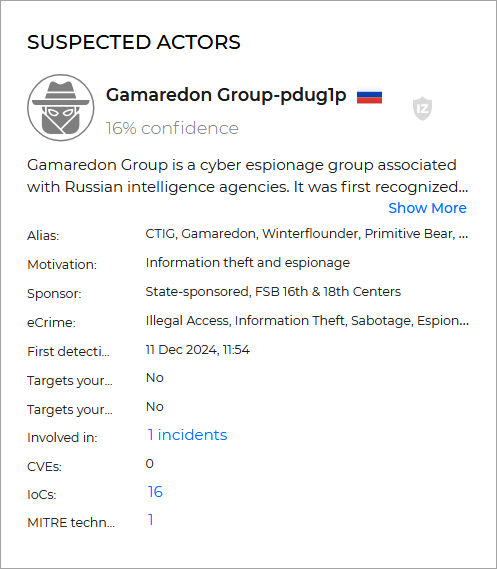
By default, the first actor dropdown is opened. Each actor displays the following information:
Actor name - The name of the actor and an associated icon.
Confidence - Percentage of confidence that an actor was involved in that incident.
Actor description - The actor description.
Pivoting button to IntelliZone. When clicking the pivot button, a new tab is opened with the a query ran in IntelliZone basic search for that IoC.
Note
This feature requires an active integration with the IntelliZone console.
For more information, refer to this kb article.
Alias - Other names given to the actor in the security landscape.
Motivation - The goal observed for the actor's attack (information theft, espionage, etc.).
Sponsor - Who may sponsor that actor.
eCrime - Type of cybersecurity crime that they are known for.
First detected on - the date this actor first targeted your company.
Targets your country - Indicates if this actor usually targets the country of the company the incident occurred in.
Targets your industry - Indicates if this actor usually targets the industry of the company the incident occurred in.
Involved in - The incidents in which the actor was involved.
Clicking on the link directs you to the Incidents page with a pre-applied filter to display related incidents.
CVEs - List of CVE ids in the current incident.
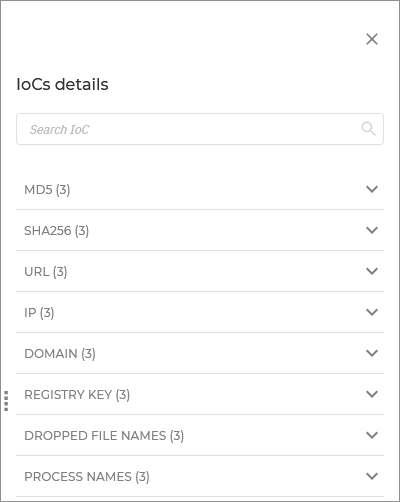
IoCs - List of Indicators of Compromise in the current incident.
Clicking on the displayed number of IoCs, the IoC details side panel is displayed, which provides you with a breakdown of indicators, grouped by type.
MITRE techniques - MITRE techniques usually used by the actor and in the current incident.
Clicking on the displayed number of techniques, the MITRE Techniques side panel is displayed, which provides you with a specific list of techniques.
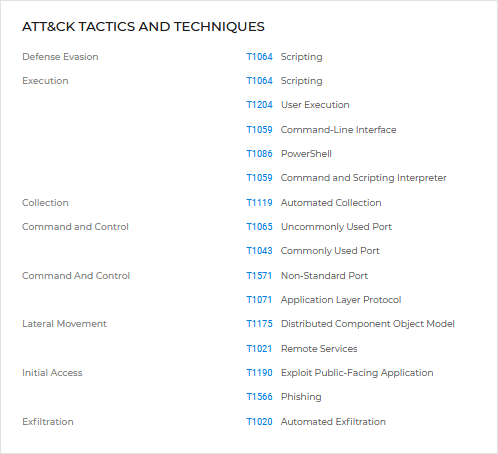
ATT&CK Tactics and Techniques
This section displays all the MITRE ATT&CK Tactics and Techniques used in the current attack.
Highlights
The Highlights display the kill chain stages within the investigated incident that have the highest impact on your organization.
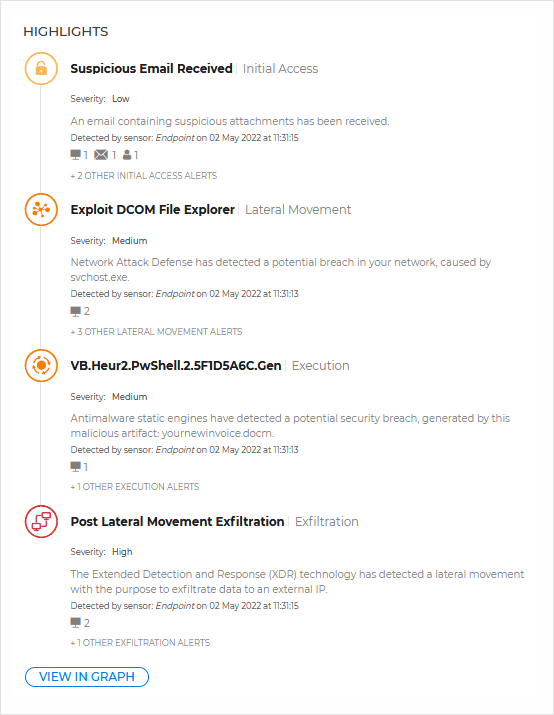
Click the View in Graph button to see the all the security events grouped by kill chain in the Activity panel.
Response
The Response area provides specific actions you can take to mitigate threats within an extended incident to quickly minimize the potential damage done to your environment.
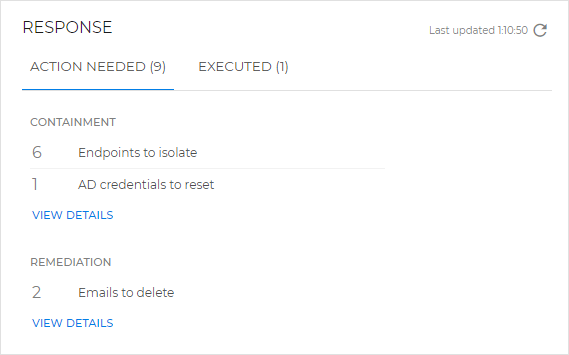
Consult the Actions needed tab to see what actions you need to take to eliminate or minimize active threats.
Consult the Actions executed tab to see what actions have already been taken to eliminate or minimize threats.
Select View Details to navigate to the Response tab where you can perform all the needed actions, see executed ones and change their status accordingly.
Associated risks
The Associated risks widget provides a summary of risks linked to entities in that specific incident and includes the following sections:
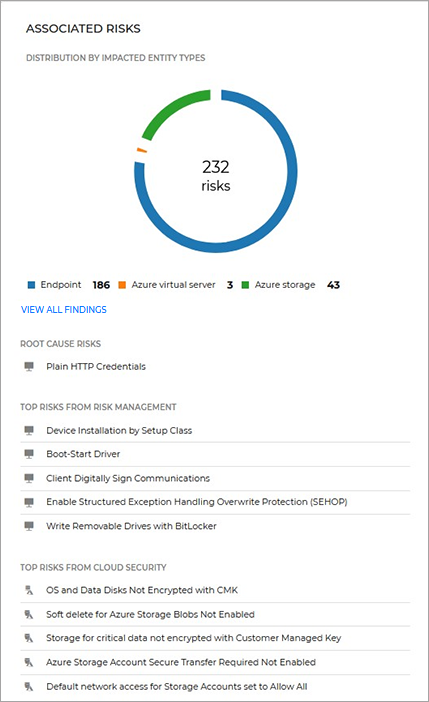
The associated risks graph - A graphical representation of the distribution of risks among the various node and resource types from that specific incident.
Clicking on any of the sections of the graph or on the View all risks button displays the Associated risks panel.
Root cause risks - This section provides a list of all the root cause risks detected for this incident.
Top risks from Risk Management - This list displays the top 5 most severe risks affecting node and resource types in this incident.
Top risks from Cloud Security - This list displays the top 5 most severe risks affecting node and resource types in the incident.
Clicking on any section of the graph, any element in the Root cause risks, Top risks from Risk Management, or Top risks from Cloud Security section, or clicking the View all risks button displays the Associated risks panel:
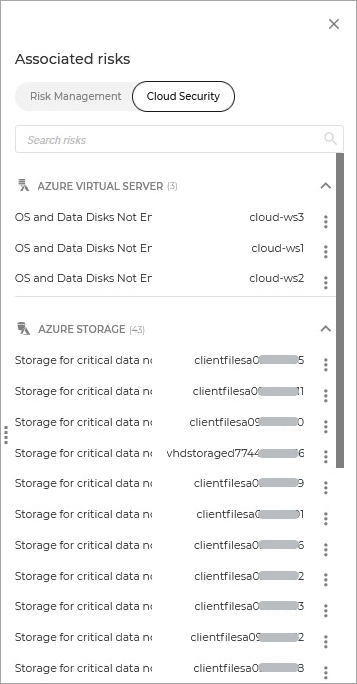
The panel has two tabs:
Risk Management. This tab provides all associated risks originating from the Endpoint Risk Analytics feature.
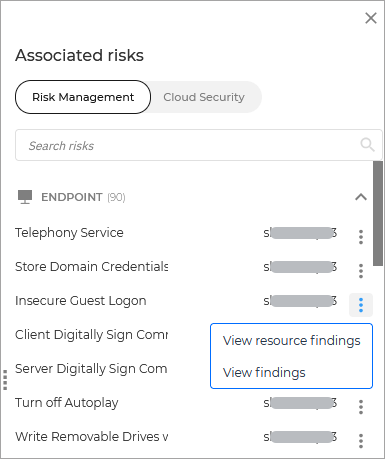
Clicking on the menu button on the right side of an endpoint provides the following options:
View resource findings - Pivots to Risk management > Resources with a filter applied for the Resource name.
View findings - Pivots to Risk management > Findings with a filter applied for the Finding name.
Cloud Security. This tab provides all associated risks originating from the Cloud Security console.
Clicking on the menu button on the right side of an endpoint provides the following options:
View rule - Pivots to Cloud Security > Posture Management > Rules with a filter applied for the finding name.
View resources - Pivots to Cloud Security > Posture Management > Resources with filters applied for the resource type and finding details.
Organization Incident Graph
The Graph displays a dynamic graphic representation of the extended incident under investigation, providing a detailed activity timeline with the sequence of correlated events caused by external agents that have occurred or are still active in your environment, on multiple endpoints and network devices.
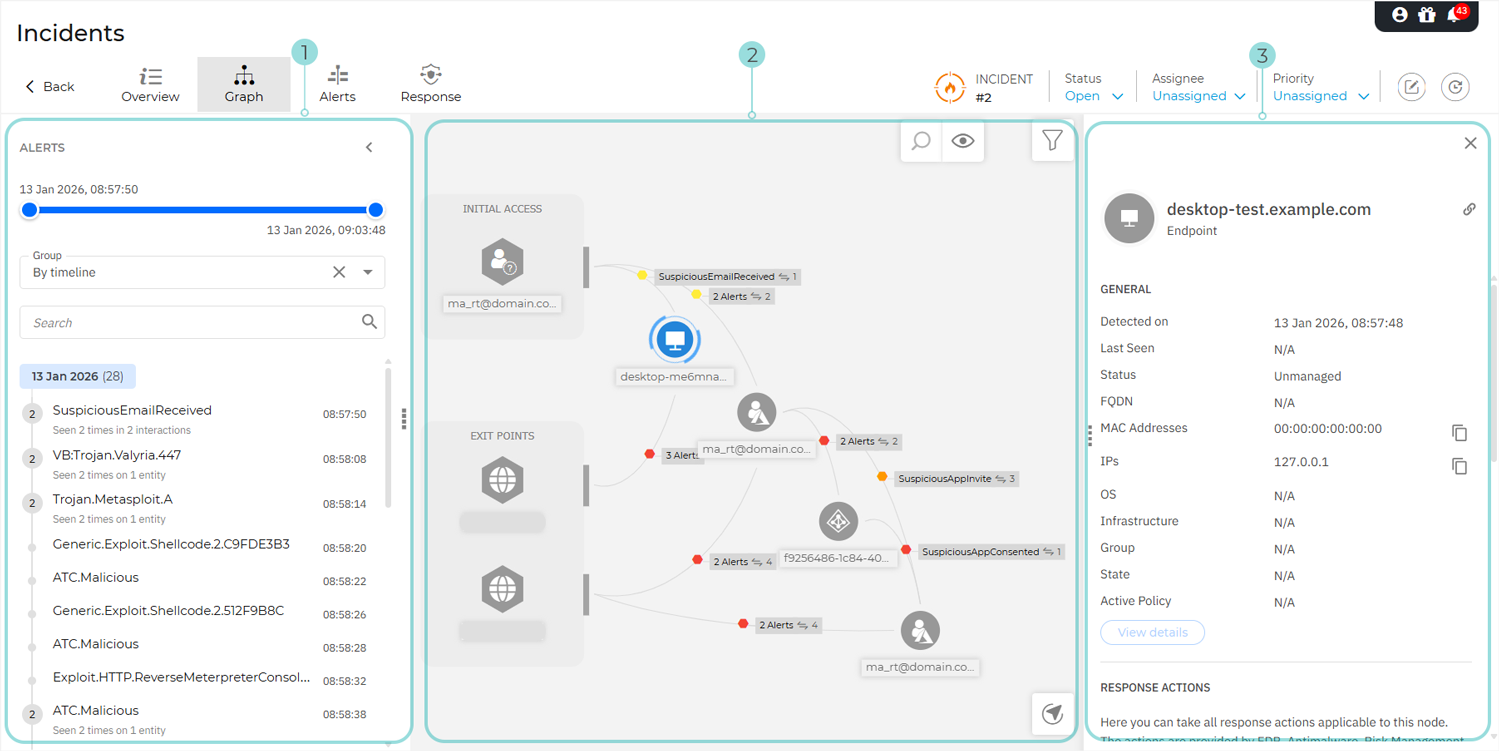
The incident graph section is grouped into three major areas:
1. Activity panel
It includes all the alerts detected and correlated in the extended incident you are investigating.
The panel is resizable; adjust its width to match your preferred view.
You can collapse the panel when more space is needed for other tasks.
The search functionality helps you find specific alerts efficiently.
Filter alerts based on precise time ranges for focused analysis.
The drop-down menu allows you to group alerts by various criteria, including time, severity, sensor, incident ID, node, alert name, or kill chain phase. For each alert group, the total number of involved resources is displayed.
To view the evolution of the attack in time, group the alerts by timeline, and go through each one.
By grouping alerts by alert name, you can merge identical alerts into one activity panel entry and easily identify all unique detections in the incident.
To better visualize which alerts are part of other correlated incidents, group the alerts by incident ID.
Click a group name to highlight all nodes and transitions that include an alert from that group. Each transition will be colored based on the most severe alert it contains.
The graph animation will show you how the attack has unfolded in your environment, performing lateral movement to jump from one entity to another, exfiltrating data, etc.
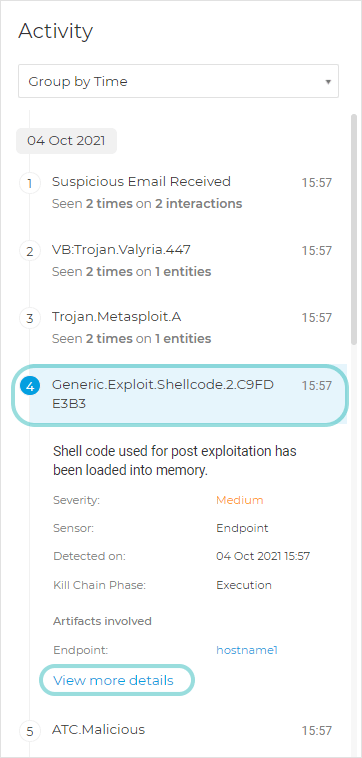
Upon clicking, each alert is expanded and various details are displayed: its name, a description of what has occurred, as well as info like the severity of the alert, the sensor that made the detection, timestamp, place in the kill chain, affected endpoints, the number of involved resources, and IP.
Selecting an alert highlights the nodes and transitions in which it appears.
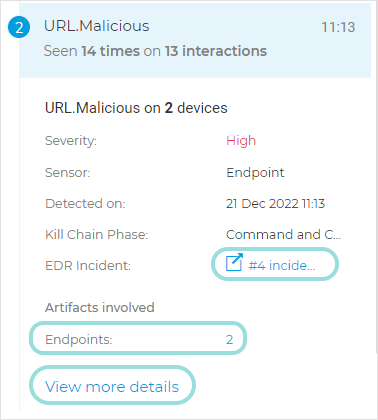
If the same alert has been detected on multiple endpoints, you can further investigate them by expanding a side panel that displays a list of them.
If the alert is also part of an endpoint incident, you can further investigate it by opening it in a new browser tab.
If you want to view additional information about this alert, click View more details to expand its details panel.
2. Graph panel
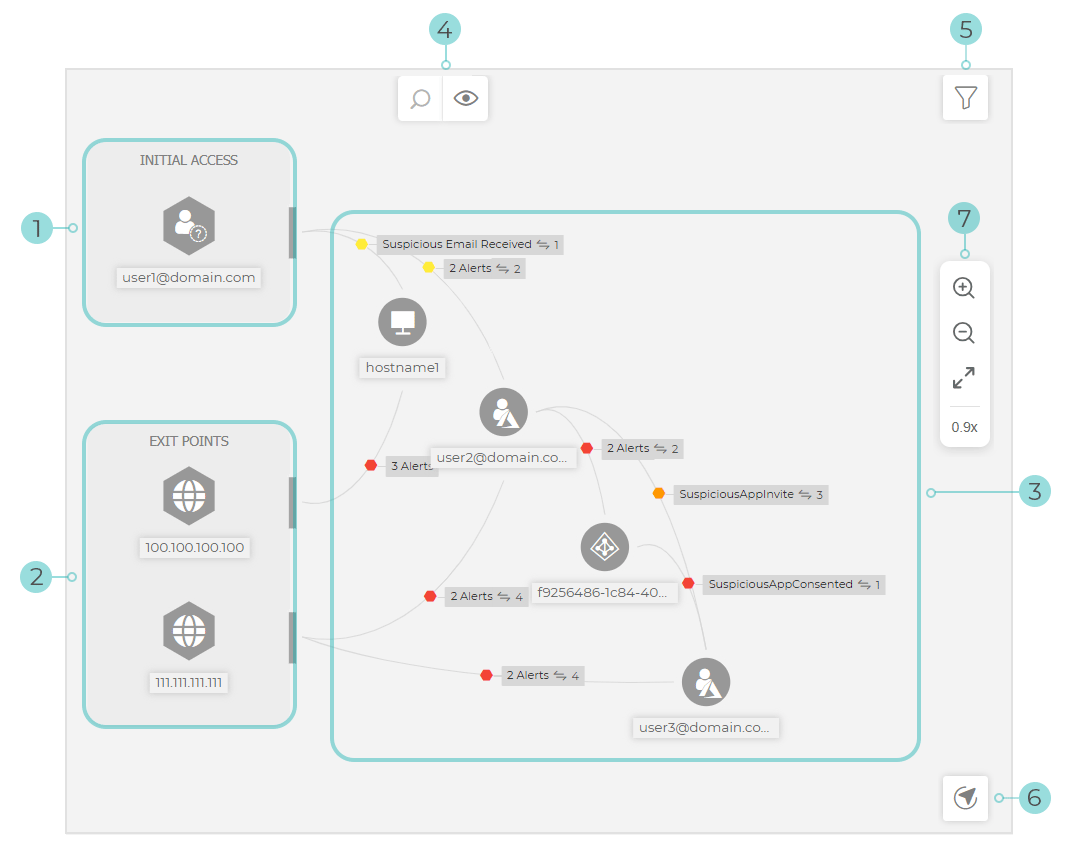
The graph contains these elements:
Initial access represents the first contact of an attacker with your environment.
Exit points represent exfiltration and command & control events.
Incident progression represents the spreading of the attack in your organization.
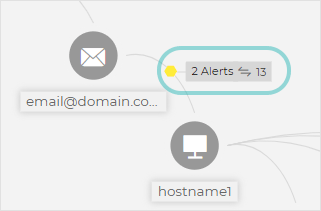
The transitions between nodes represent the interactions between the entities involved in the incident. They are displayed as elements with different colors, depending on the severity of alerts triggered as a result of the interaction.
The graph supports and displays specific elements from data provided by all the sensors you have integrated in GravityZone. Learn more about all the sensors you can integrate to enhance your XDR here.
The Search nodes bar provides the following features:
Search for nodes by name
Hide alerts labels
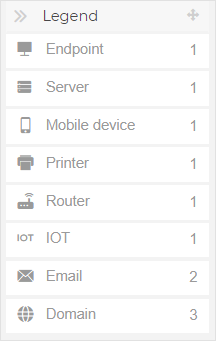
The Legend displays the types of elements correlated in the extended incident you are analyzing. You can search names or file extensions of incident components in the search field and the results will be displayed in the side panel.
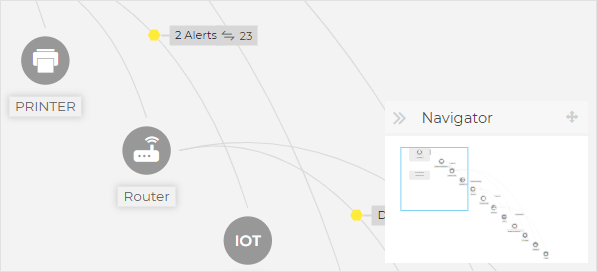
The Navigator enables you to quickly move through the incident graph and explore all displayed elements by using the mini-map and the different levels of visualization.
Click and hold the  Drag icon to position the floating Navigator panel anywhere inside the incident graph.
The Navigator is collapsed by default. When expanding it, the menu will display the miniaturized version of the entire incident map, and action buttons to adjust the level of visualization.
EDR and XDR graphs support zooming via the mouse wheel, touchpad, and the Zoom in and Zoom out buttons located on the right side of the Incidents > Graph tab.
A zoom level indicator is displayed below these controls, along with a Reset zoom button that restores the zoom level to 1x.
3. Node details panel
Once in the Incidents > Graph tab, you can click any node in the graph to open its details panel. This panel provides contextual information about the selected entity involved in an Organization incident, helping you understand its role within the incident. It displays key identification details, associated alerts, available response actions, and interactions with other entities.
Note
The details panel content is dynamically adjusted based on the node type and the telemetry available at the time of the investigation.
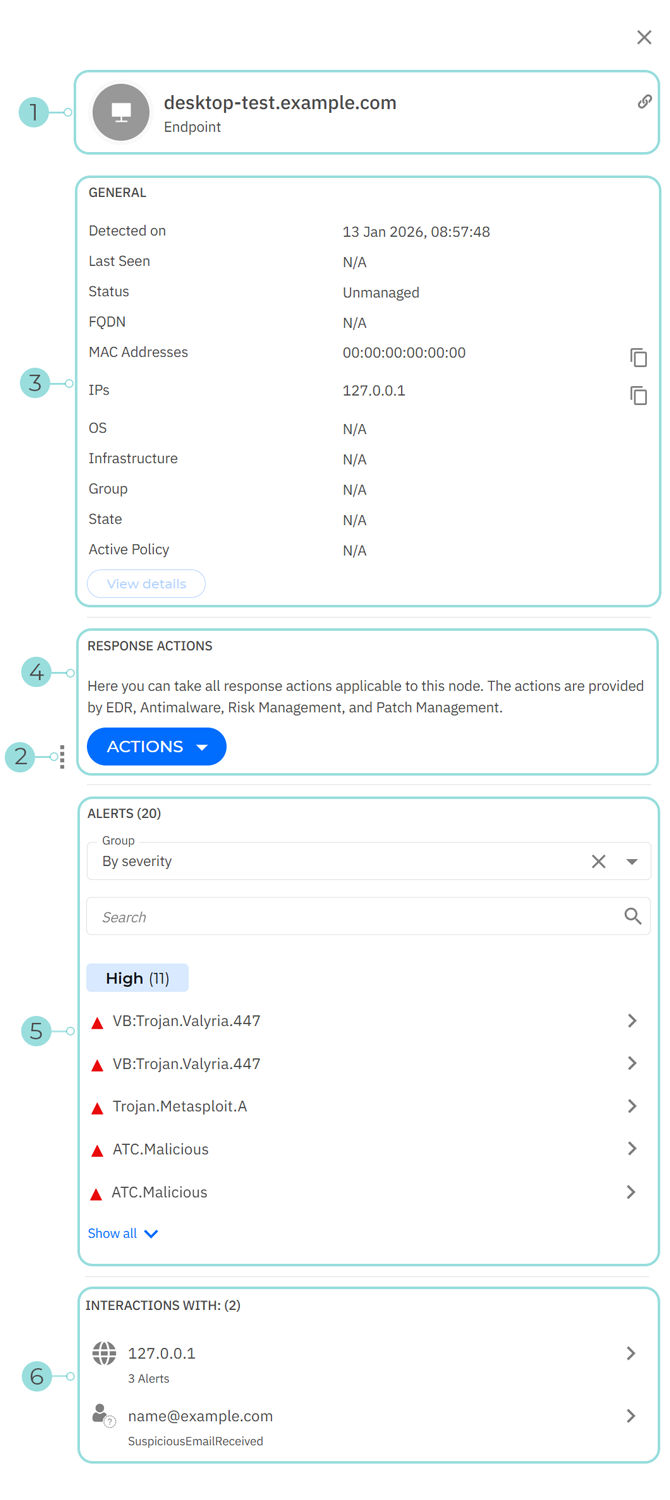
The header of the details panel displays the node name, node type, and a Copy link icon that allows you to copy the link to the selected node to the clipboard.
The vertical ellipsis button allows you to drag the panel for horizontal resizing, making it easier to view its contents.
The General section displays core identification details about the selected node.
The displayed information varies depending on the node type.
Important
For graph nodes generated via the Security Data Lake integration rather than an XDR sensor, the Sensor field indicates the external Security Data Lake data source.
The Response actions section allows you to initiate security actions directly on the selected node. Clicking the Actions button displays a contextual menu with the available response actions.
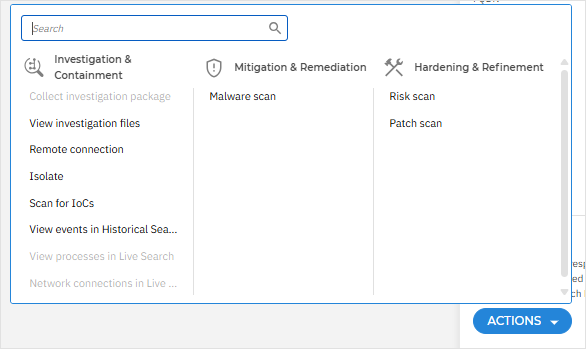
Selecting an available action initiates the corresponding response workflow for the selected node.
Note
The availability of response actions depends on the node type.
Response actions are organized into the following categories:
The Alerts section displays all security alerts associated with the selected node, providing visibility into detected threats and suspicious activity.
Alerts are grouped by severity by default. Using the Group selector, you can reorganize alerts based on different criteria, including:
Timeline
Kill chain phase
Sensor
Severity
Incident ID
A Search field is also available to help you quickly filter alerts by name.
Clicking any alert opens its corresponding details panel.
The Interactions section displays the entities that have interacted with the selected node and are associated with related security activity. Each listed entity includes a summary of the related alerts, providing additional context on how the node is involved in the incident.
Selecting any interaction opens its details, allowing you to further investigate the related entity, review associated alerts, and understand the relationships between nodes within the incident.
Organization Incident Alerts
Use the Alerts tab to view how the sequence of events unfolded into triggering the currently investigated incident. This page displays the correlated system events and alerts detected by GravityZone technologies, such as EDR, Network Attack Defense, Anomaly Detection, Advanced Anti-Exploit, Windows Antimalware Scan Interface (AMSI).
Every complex event has a detailed description explaining what was detected and what might happen if the artifact is used for malicious purposes, in accordance with the latest MITRE techniques and tactics.
Each listed alert includes:
The ATT&CK technique used
The alert's place in the kill chain
The way it affects your organization
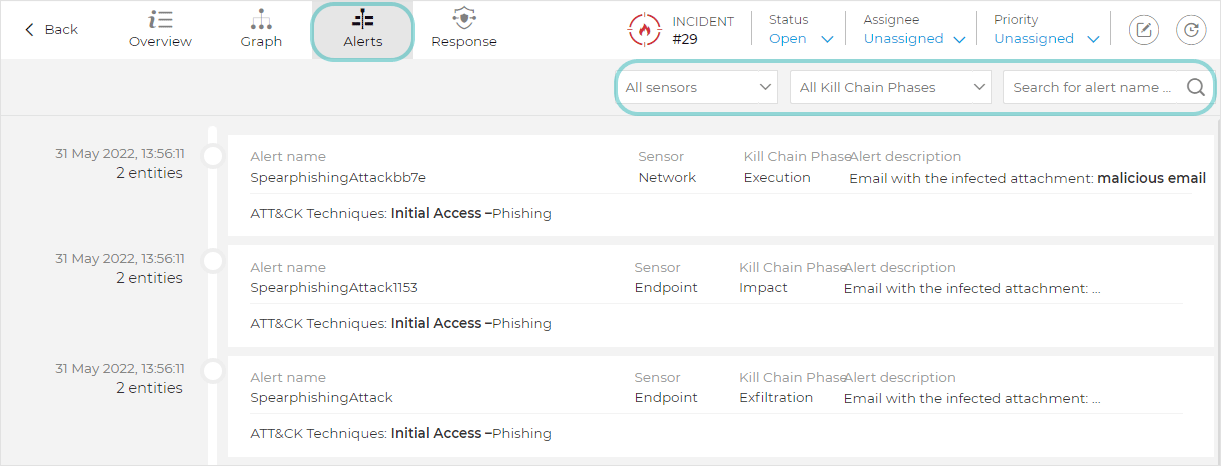
You can filter these alerts by using the following options:
Use the All sensors drop-down menu to enable alerts from all sensors, or just one of the sensors.
Use the All Kill Chain Phases drop-down menu to enable alerts that are part of a certain phase in the kill chain, from all kill chain phases.
Use the Search for alert name field to search alerts by name or file extension.
Clicking an alert opens the corresponding details panel.
Alert details panel
The details panel provides in-depth information about an individual alert.
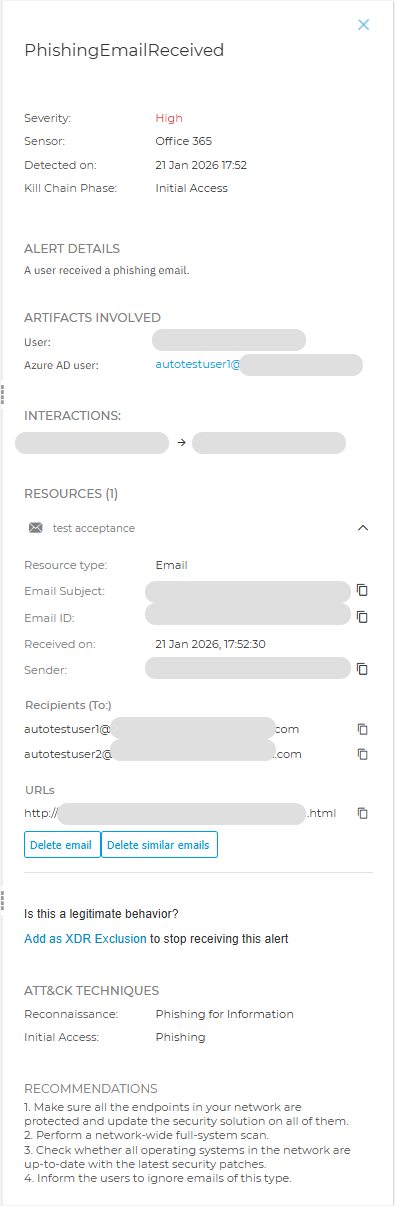
It is organized into the following sections:
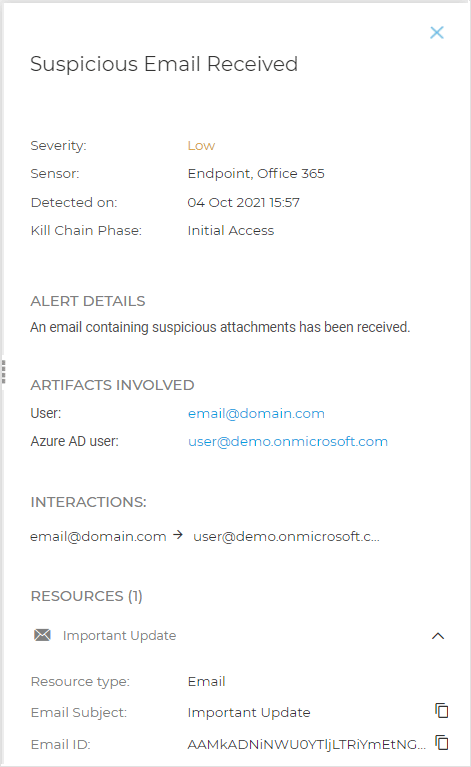
Header: Provides high-level information about the alert, allowing you to assess its importance and origin quickly. It displays:
The alert name
The severity level
The sensor that generated the alert
Important
For alerts received via the Security Data Lake integration, the Sensor field indicates the external data source of Security Data Lake, such as Palo Alto or Fortigate.
The date and time when the alert was detected
The corresponding kill chain phase
Alert details: Provides a concise, human-readable description of the detected security event.
Artifacts involved: Lists the entities directly associated with the alert, such as users or accounts, helping identify who or what was affected by the detected activity.
Interactions: Displays the relationships between the entities involved in the alert.
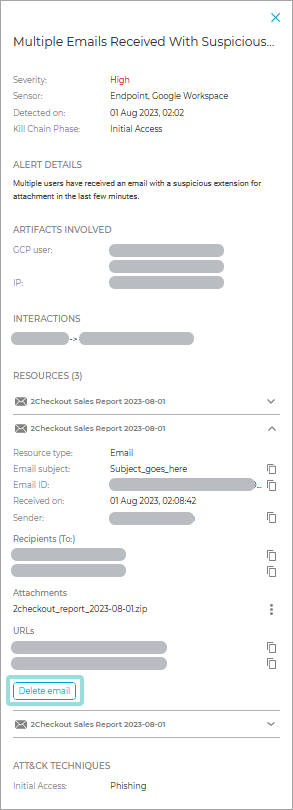
Resources: Displays the objects associated with the alert, such as emails, sharing links, applications, files, or URLs, providing detailed information for each resource.
The Add as XDR Exclusion option allows you to mark the detected behavior as legitimate and exclude it from future XDR detections. When added, the behavior will no longer be treated as suspicious or malicious, and alerts or incidents triggered by the same activity will no longer be generated in the Incidents page.
For email resources, the following response actions may be available:
Delete email: Deletes the suspicious email.
Delete similar emails: Allows you to quickly delete multiple Microsoft 365 emails identified as similar to the reference email in the alert details panel.
For details about the Delete similar emails procedure, refer to Deleting similar emails.
For file-type resources, a Delete file option is available; the file is moved to the Trash folder, and this functionality is supported only for Microsoft 365.
ATT&CK techniques: Displays the MITRE ATT&CK techniques associated with the alert, mapped to the corresponding kill chain phases, helping identify the tactics and methods used in the detected activity.
Recommendations: Provides guidance on actions that can help remediate the detected threat and reduce the risk of similar incidents in the future.
Deleting similar emails
To delete emails similar to the resource email from the alert details panel, follow these steps:
Once in the alert details panel, click Delete similar emails from the Resources section.
You are redirected to the Select emails to delete page. This page displays a list of emails similar to the reference email, identified based on a similarity hash.
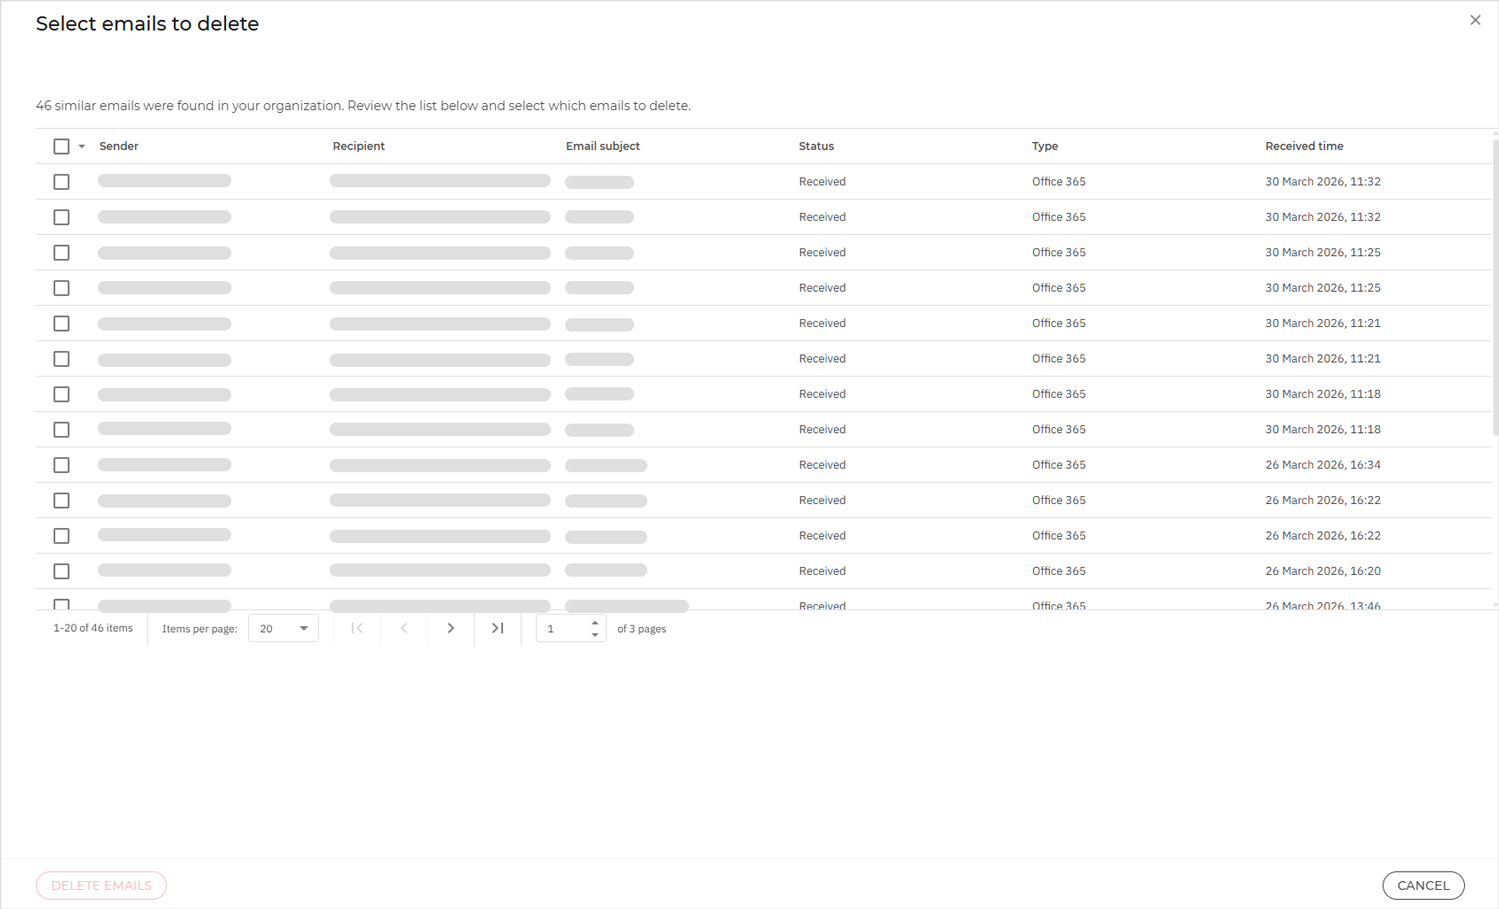
Tip
For emails with multiple recipients, click the link in the recipients column to open a side panel displaying the list of recipient email addresses.
Select the emails to be deleted in bulk. The selected emails will be moved to the Outlook Recycle Bin.
Important
This action cannot be reverted from GravityZone.
A maximum of 1,000 emails can be deleted per operation.
Click Delete emails, then click Delete emails again to confirm.
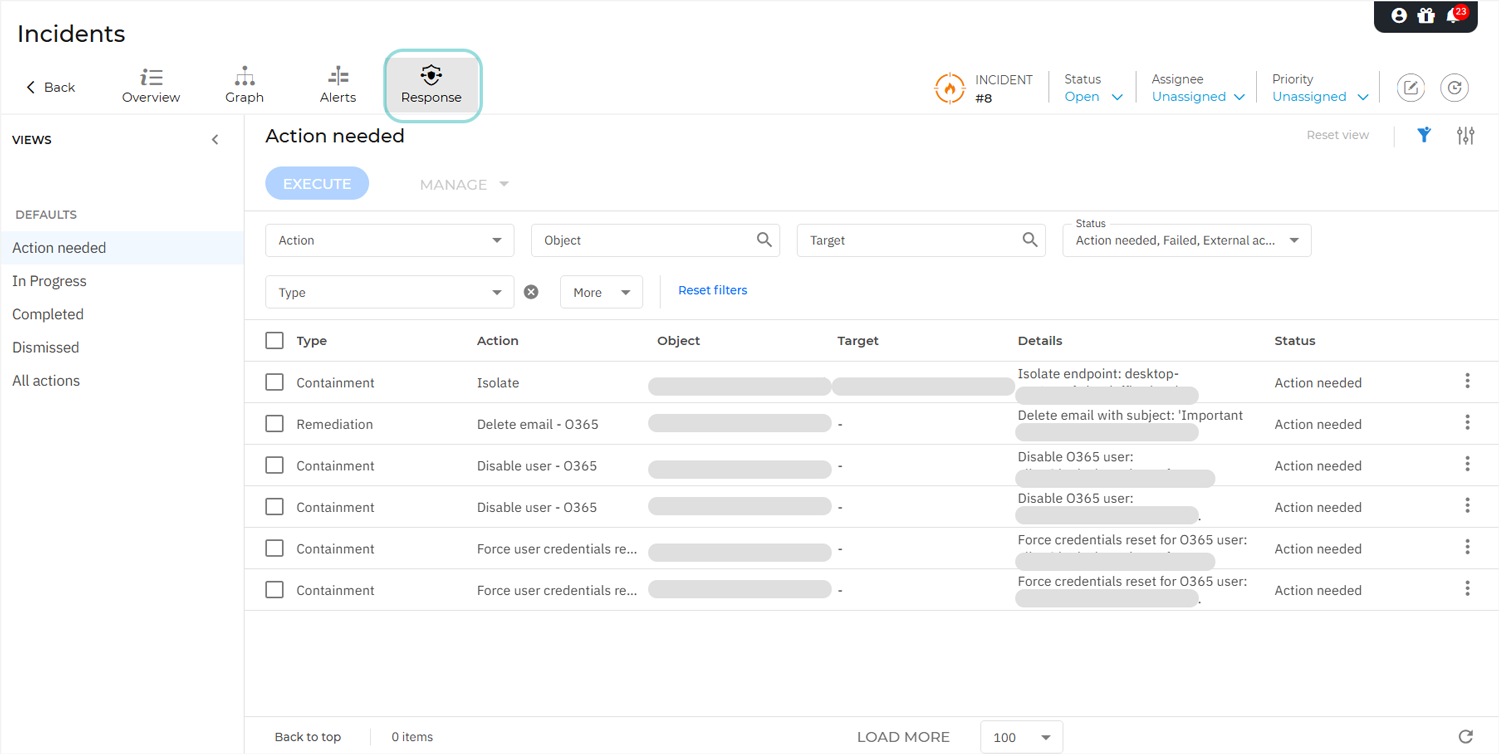
To verify whether the action was successful or failed and view its result, go to Incidents > Response:
If the action completes successfully, it is displayed under Completed with a Successful status.
Tip
If you did not delete all identified similar emails and want to remove additional ones later, return to the alert details panel and click Delete similar emails again to repeat the process.
If only some of the selected emails are successfully deleted while others fail due to permanent issues, such as the email no longer being available, the action is displayed under Completed with a Successful status and cannot be retried.
If the action fails, meaning no emails are deleted, or some of the selected emails cannot be deleted due to issues such as insufficient permissions or invalid authorization keys, it is displayed under Action needed with a Failed status.
Tip
You can retry the failed action from the Response > Action needed tab or by initiating the action again from the alert details panel.
Tip
The result details are not displayed by default. To view them:
Open the Settings panel.
Select Details.
Click Apply.
You can also perform the Delete similar emails remediation action from the incident Response > Action needed tab.
Organization Incident Response
The Response page is where you can take immediate actions to eliminate or minimize threats discovered in your environment, displayed in the extended incident you are investigating.
All actions are available in a dynamic grid formation with multiple filtering and sorting options, such as filtering by action type, action status, execution timeframe, and more.
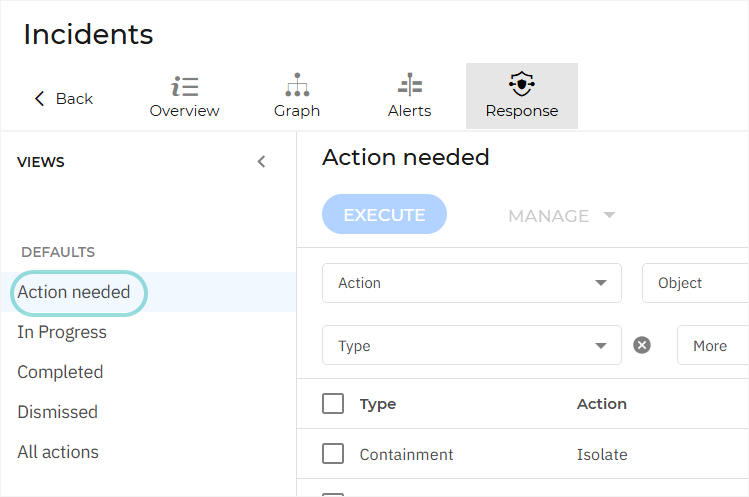
The Response page provides default smart views that you can use to access:
Actions that need immediate attention
Actions that have been executed already
Actions that have been dismissed
Actions in progress
All actions
Select the Action needed view so you can execute urgent actions to protect your environment.
Execute each task individually, or select all of them from the grid for bulk execution:
To execute a task individually, you can select it from the grid and click the Execute button, or access its menu (vertical ellipsis icon) and click Execute.
To execute bulk actions, select multiple actions from the grid and click Execute.
Upon executing an action, its status goes through several stages: Action needed > Pending > In progress.
If the action can be completed by the system, its status changes to Successful, and the executed action is moved and available to access in the Completed view.
If the action cannot be completed by the system, its status changes to Failed, and the action stays in the Action needed view until you execute it successfully.
If you don't need to execute an action, manage it from the Manage menu or from the action's card menu.
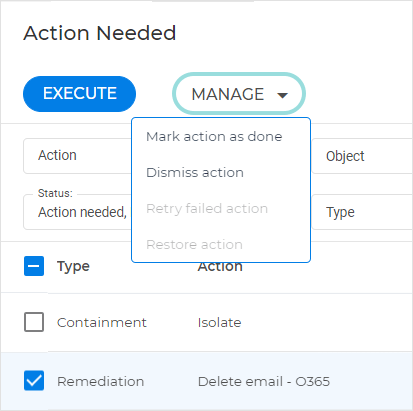
Use the Mark action as done option for actions that are no longer needed because they may have been completed using a different method. These actions are moved to the Completed view.
Use the Dismiss action option to remove useless actions. These actions are moved to the Dismissed view.
You can restore any dismissed or marked as done action to its previous status.
Important
Actions with the External action needed status cannot be automatically executed from the Response tab, and you have to execute them manually. Afterwards, you can mark it as done or dismiss it, depending on how you prefer.
Response actions
The actions you can take in the Response page, the Action needed view, to minimize or eliminate threats in your environment are grouped in the following categories:
Isolate: Disconnects the endpoint from the network to prevent potentially malicious activities, such as lateral movement, from spreading to other workstations. When an endpoint is isolated, it can only communicate with GravityZone.
Remove from isolation: Reconnects the endpoint to the network.
IOC Scan: Starts an on-demand scan to search for specified known Indicators of Compromise (IoCs) on the target endpoint.
Deactivate AWS account: Deactivates the AWS user account and removes all associated access keys. This action is available for users who have activated the AWS sensor.
Mark as compromised: Marks the account as high risk in Microsoft Entra ID Protection. The resulting enforcement and remediation are determined by the policies configured by the Microsoft Entra administrator.
Note
This action applies to the Azure AD or Microsoft 365 users.
Disable user - O365, Disable user - AD, Disable user - Google Workspace, Disable user - Atlassian: They disable the user account, blocking login access.
Force user credentials reset - O365, Force user credentials reset - AD, Force user credentials reset - Atlassian, Force user credentials reset - Google: They require the user to update their authentication details at the next login.
Delete email - O365, Delete email - Google Workspace: They permanently delete the entire email thread to prevent the spreading and execution of malicious payloads in your organization.
Delete similar emails - O365: Allows you to quickly delete multiple emails identified as similar to a reference email.
Delete file - O365: Removes the malicious or unwanted file from Microsoft 365 environments.
Manage asset: Recommends the installation of a security solution on an unmanaged asset within your organization.
Patch scan: Checks the target endpoint for outdated or missing software updates.
Important
Requires a Patch Management license and the feature to be enabled in the endpoint policy.
Tip
To harden the security posture of your company, you can reduce the surface of potential attacks by ensuring proper system configuration. Learn more about hardening measures you can take in Risk Management. Additional info is also available in Indicators of Risk.
Risk scan: Scans the target endpoint for risks.
Malware scan: Starts a malware scan on the target endpoint to identify malware threats.
Status Bar
The status bar provides security event tags that can help you detect key information about the extended incident you are analyzing.
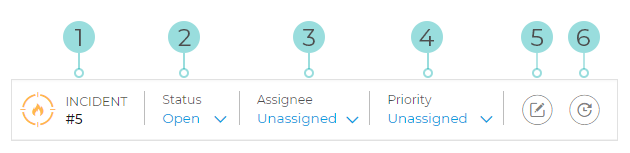
Incident ID - the id number of the incident under investigation.
Status - the status of the incident.
Assignee - the user that the incident is assigned to.
Priority - the priority of each incident.
Notes - this button provides a list of analyst notes.
History - this button provides the history of the incident.
Tip
Clicking the Back button takes you back to the Incidents page.
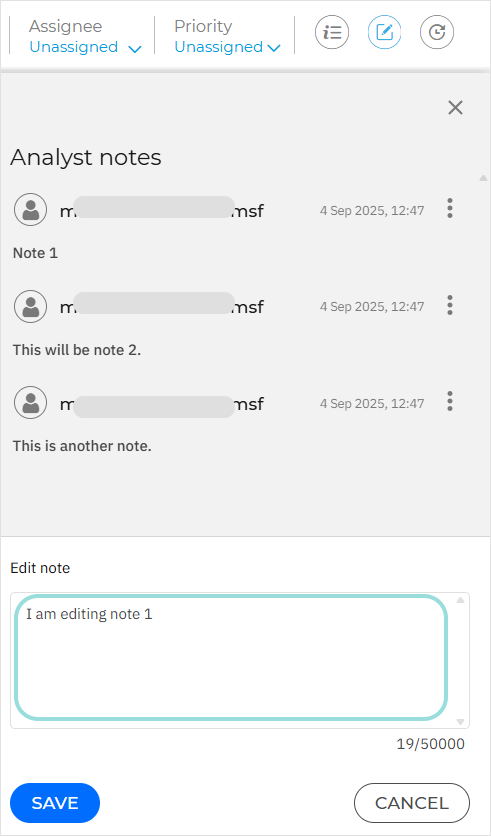
Notes clipboard
The Notes clipboard provides an easy way to add notes to incidents for tracking changes and incident ownership.
Displaying notes
To display a list of available notes, click the Notes button on the right side of the Status bar:
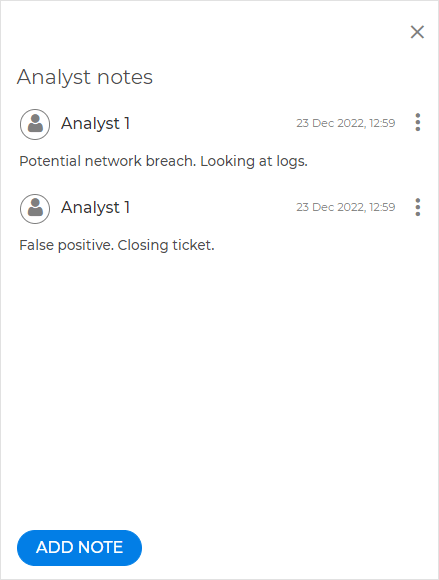
Note
Alongside each note, the username of its creator will be displayed. If the user belongs to a partner company, the name Partner will be displayed instead.
Adding a note
To add a note, follow the steps below:
Click the Add note button on the lower left side of the clipboard.
Fill in the note information.
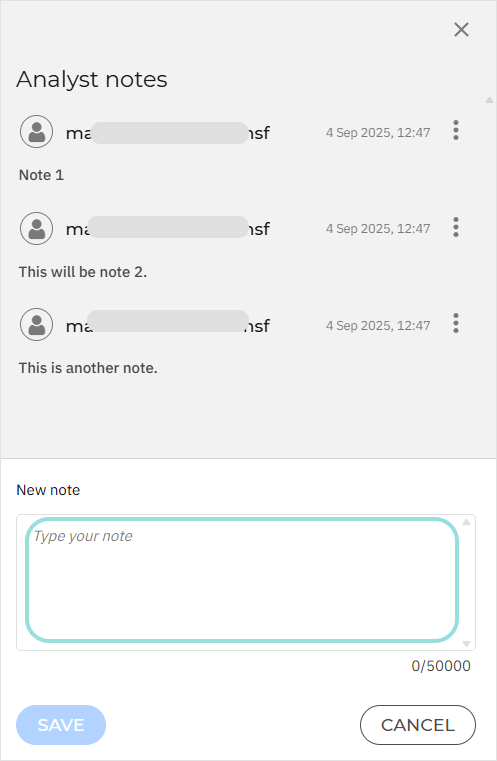
Note
Each note can contain up to 50,000 characters.
Select Save.
Note
In case of bulk actions, a single note will be added in bulk for all incidents.
Editing a note
To edit a note, follow the steps below:
Select the Menu button on the right side of the note you wish to edit.
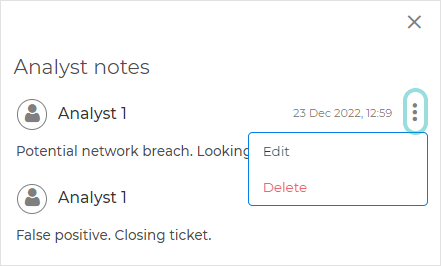
Select Edit.
Make the necessary modifications:
Note
Each note can contain up to 50,000 characters.
Select Save.
Note
If you wish to cancel editing the note, click Cancel, then select Discard.
Deleting a note
To delete a note, follow the steps below:
Select the Menu button on the right side of the note you wish to delete.
Select Delete.
Note
This option is only available for your own notes.
Select Delete again.
History Clipboard
The History panel provides an easy way to track the history of an incident. The following events are tracked:
Status changed
Assigned or reassigned incident
Incident priority set or changed
Incident note added, edited, or deleted
Created incident
Updated incident
The list is displayed in chronological order from newest at the bottom to oldest at the top:

Each event will contain the following information:
The type of the event
A description of the event
The date and time at which the event occurred
Note
The Created event also displays the Severity Score of the incident. The Updated event displays the incident’s new Severity Score, enabling security analysts to spot increases in incident severity that could indicate higher organizational risk.
Some events, such as Assigned, Status changed, and Priority changed, also include details about the user who performed the action.
XDR demo mode
The XDR demo mode feature simulates a scenario from multiple sensors and showcases the capabilities of the XDR feature.
To enable this feature, click the Show demo incident button on the upper right side of the Incidents page:
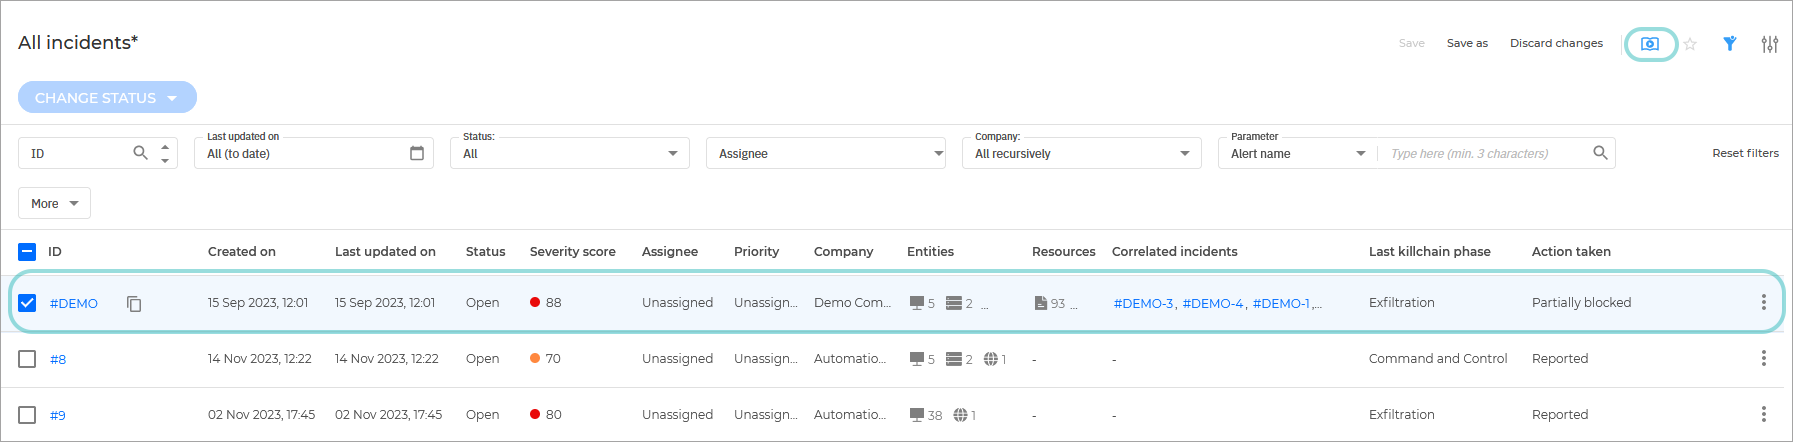
Once enabled, the following entities and information is made available:
An XDR parent incident includes a #DEMO tag that displays a scenario containing an Azure AD integration.
Multiple EDR incidents appear in the Correlated incidents column of the parent XDR incident.
Raw events, alerts, and xalerts. You can search for them using the
alert.incident_number: Demoin combination with any other search parameters query in the Search page.Tip
Use
ANDwhen combining multiple search parameters.Example - display all alert type events in DEMO mode:
Important
Make sure you use the demo parameter at the end of your query.
other.event_type: alert AND alert.incident_number: DEMO
Incident related events and alerts. You can access them clicking the Incident actions button and selecting View events and alerts.
You can hide the demo by clicking the Hide demo incident button on the upper right side of the Incidents page.
Tip
The filters section remains unchanged.
The Change status option from the grid in the Incidents page is not available for demo incidents. Clicking the button will not change the status of the incident.
Viewing #DEMO incident details
To display additional information regarding any specific incident, use one of the methods below:
Display the Incident details panel for the XDR incident: click anywhere on the row belonging to the #DEMO incident (except the ID, Resources, Entities, and Correlated incidents columns):
Display the Incident details panel for the EDR incident: click their ID under the Correlated incidents column.
Display the Incident Overview: click on its ID under the ID column. Incident information is listed in a rich card format, providing an overview of each incident, with information based on the selected filters.
Copy the link to the incident: hover your cursor to the right of the ID column and click on the Copy button when it appears.
When displaying details for a demo incident, you can see the Overview, graph and Response actions just like any other incident, however, you cannot perform any action on any of them.
Security Analysts can simulate a incident investigation workflow by using the change status, change priority, assign incident and add notes actions. Any changes made to the incident can be seen in the Incident History tab and are only saved while you are viewing it.
Investigating an Endpoint Incident
The Endpoint Incidents tab displays all suspicious incidents detected at endpoint level, that require investigation and upon which no action was taken yet.
In the Endpoint incidents tab, identify the security event you want to analyze from the incidents grid.
Use the View Graph button in the incident card to open the Incident graph in a new page, or
Select a security event card to open its details panel for a quick look at the most important attack indicators of that incident.
After opening the incident graph you can see sequence of events that led to triggering the incident, and provides options to take remediation actions.
By default, the graph highlights the Critical path of the incident, and the event that triggered the incident.
Start analyzing the information displayed in the details panel of the trigger node, to find what is the root cause of the incident.
In the panel you can find valuable info like the alerts detected on the trigger node, the date and time of the event, and command lines that were executed by the attacker.
If the situation allows it, select the Add to Sandbox button to detonate suspicious or malicious elements and see the Sandbox report to evaluate the damage they may have cause to your environment.
Tip
To make sure you did not miss anything, investigate the incident nodes on the same level as the trigger node.
You can continue to analyze the other elements constituting the critical path until you get a clear picture of what caused the incident.
If the threat is real take appropriate actions to mitigate it. Learn more about available actions in Node details.
If the threat is not real you can go to the Status menu at the top of the graph and set the status of the incident to False positive, and start investigating the next incident in the list.
Note
You can use the Notes clipboard to leave insights about the incident, to provide context in case other users reopen the incident.
When further investigation is needed, navigate to the Events tab to see all the raw events and alerts that were spawned as part of the incident under investigation.
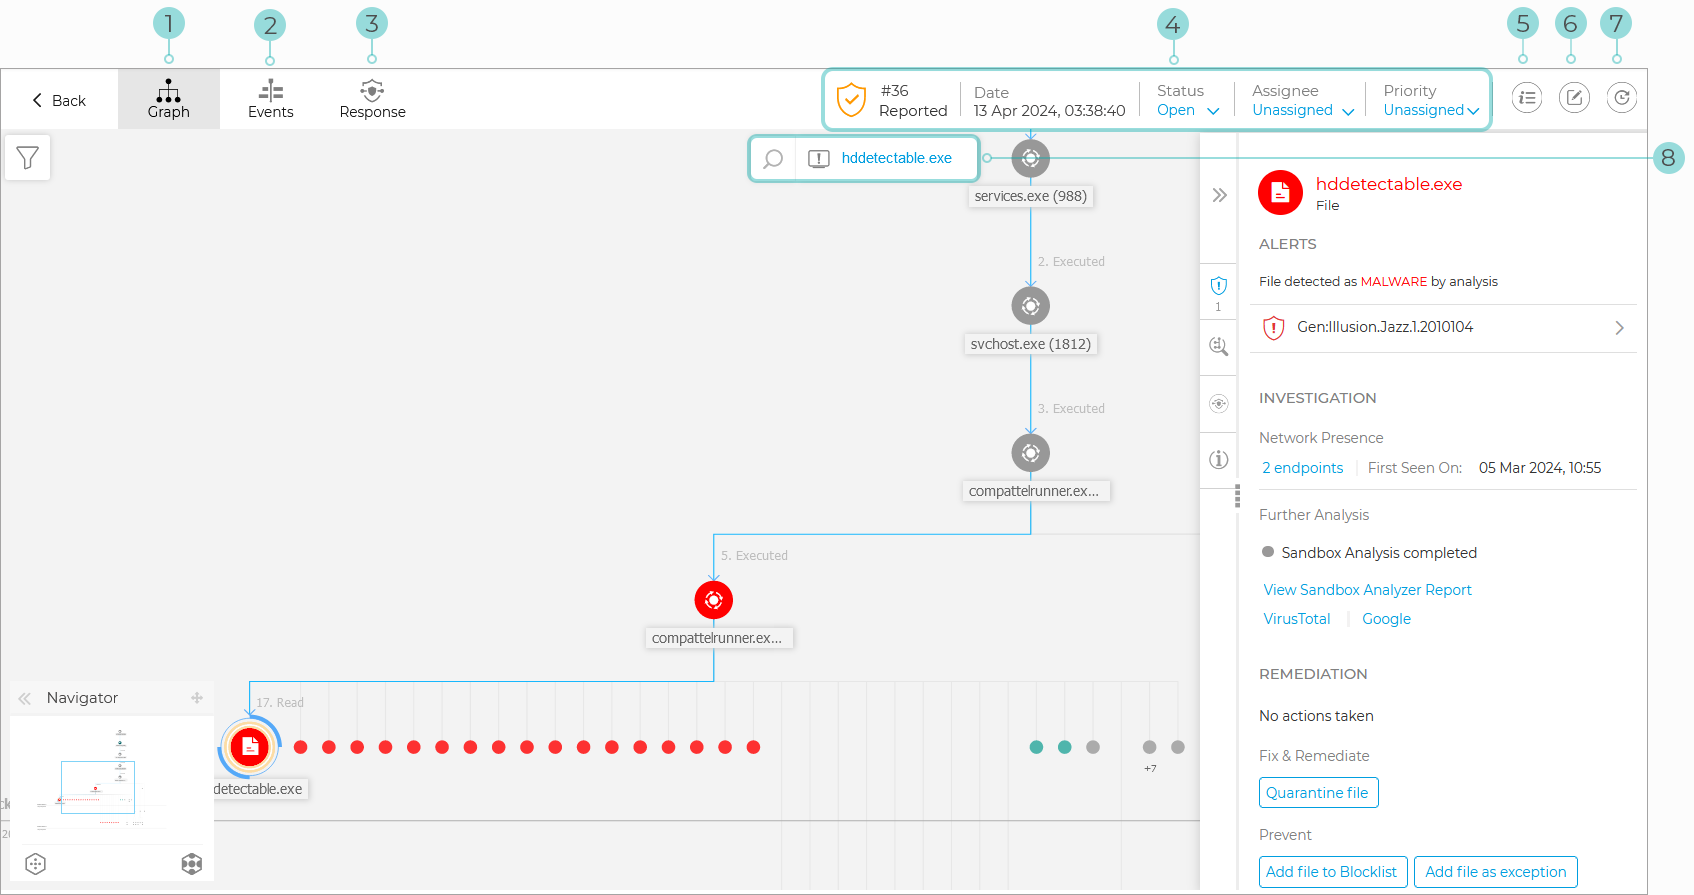
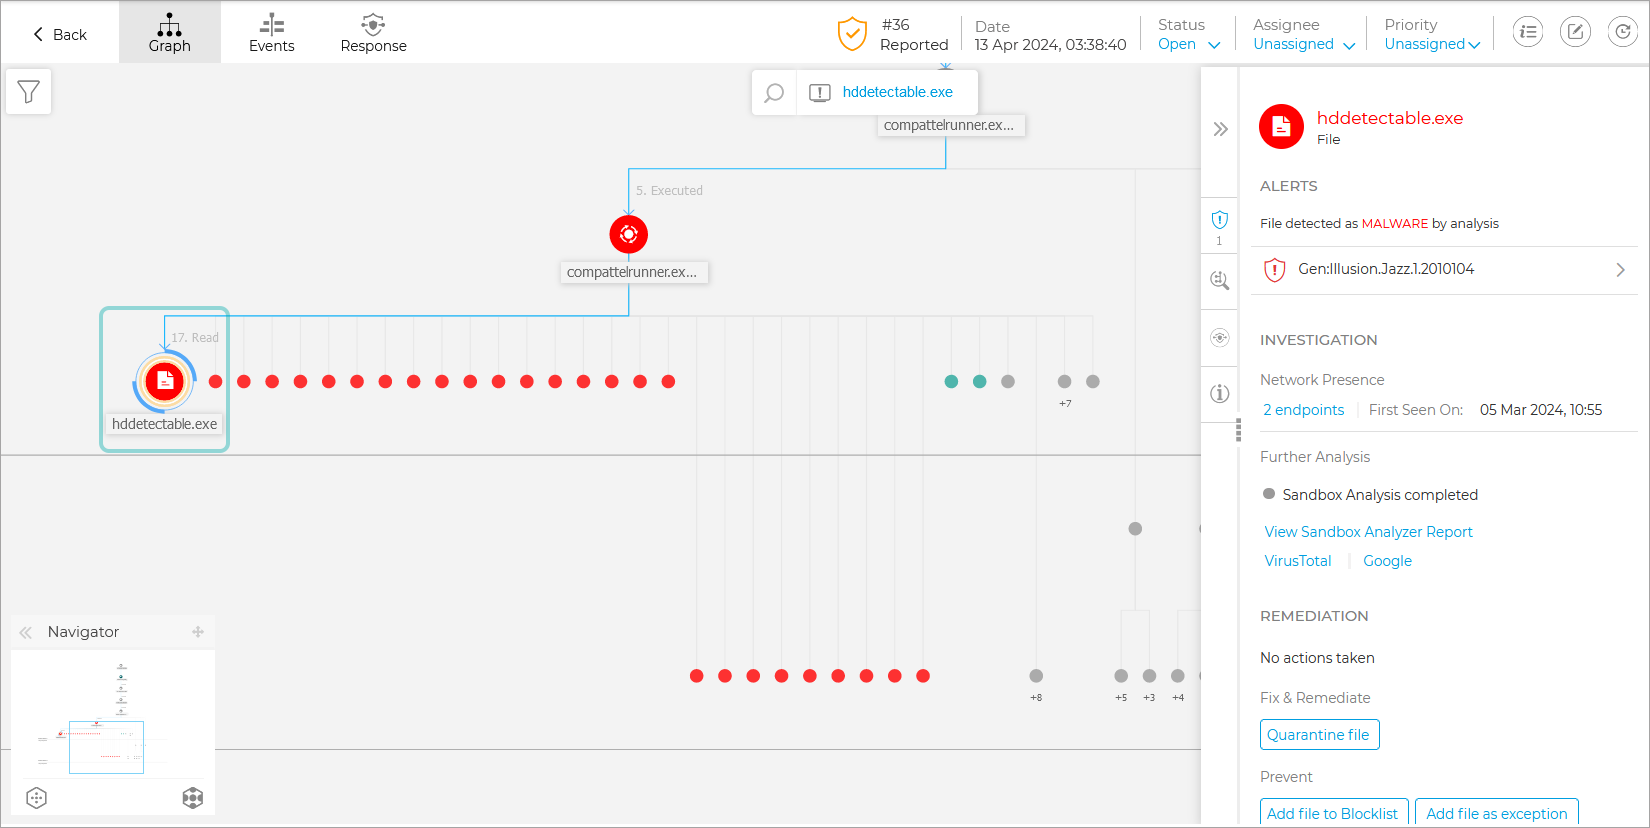
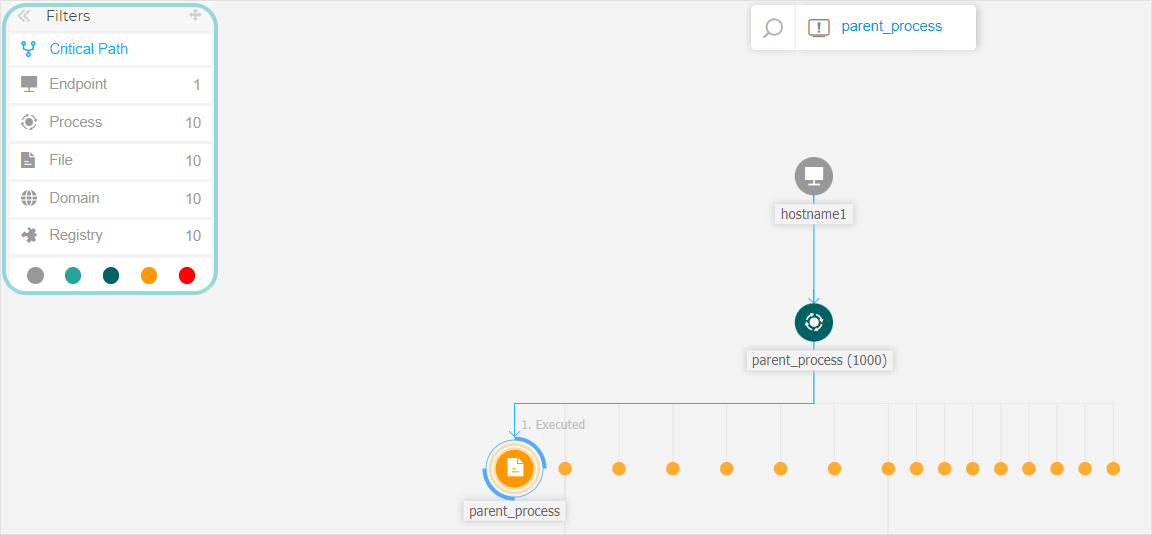
Graph
The Graph provides an interactive graphical representation of the investigated incident and its context, highlighting the sequence of elements directly involved in triggering it, known as the Critical path of the incident, as well as all the other elements involved, faded out by default.
The Graph includes filtering options that allow the customization of the incident graphic to improve visualization, and details panels with more information about each element, to facilitate the investigation of what happened in your environment.
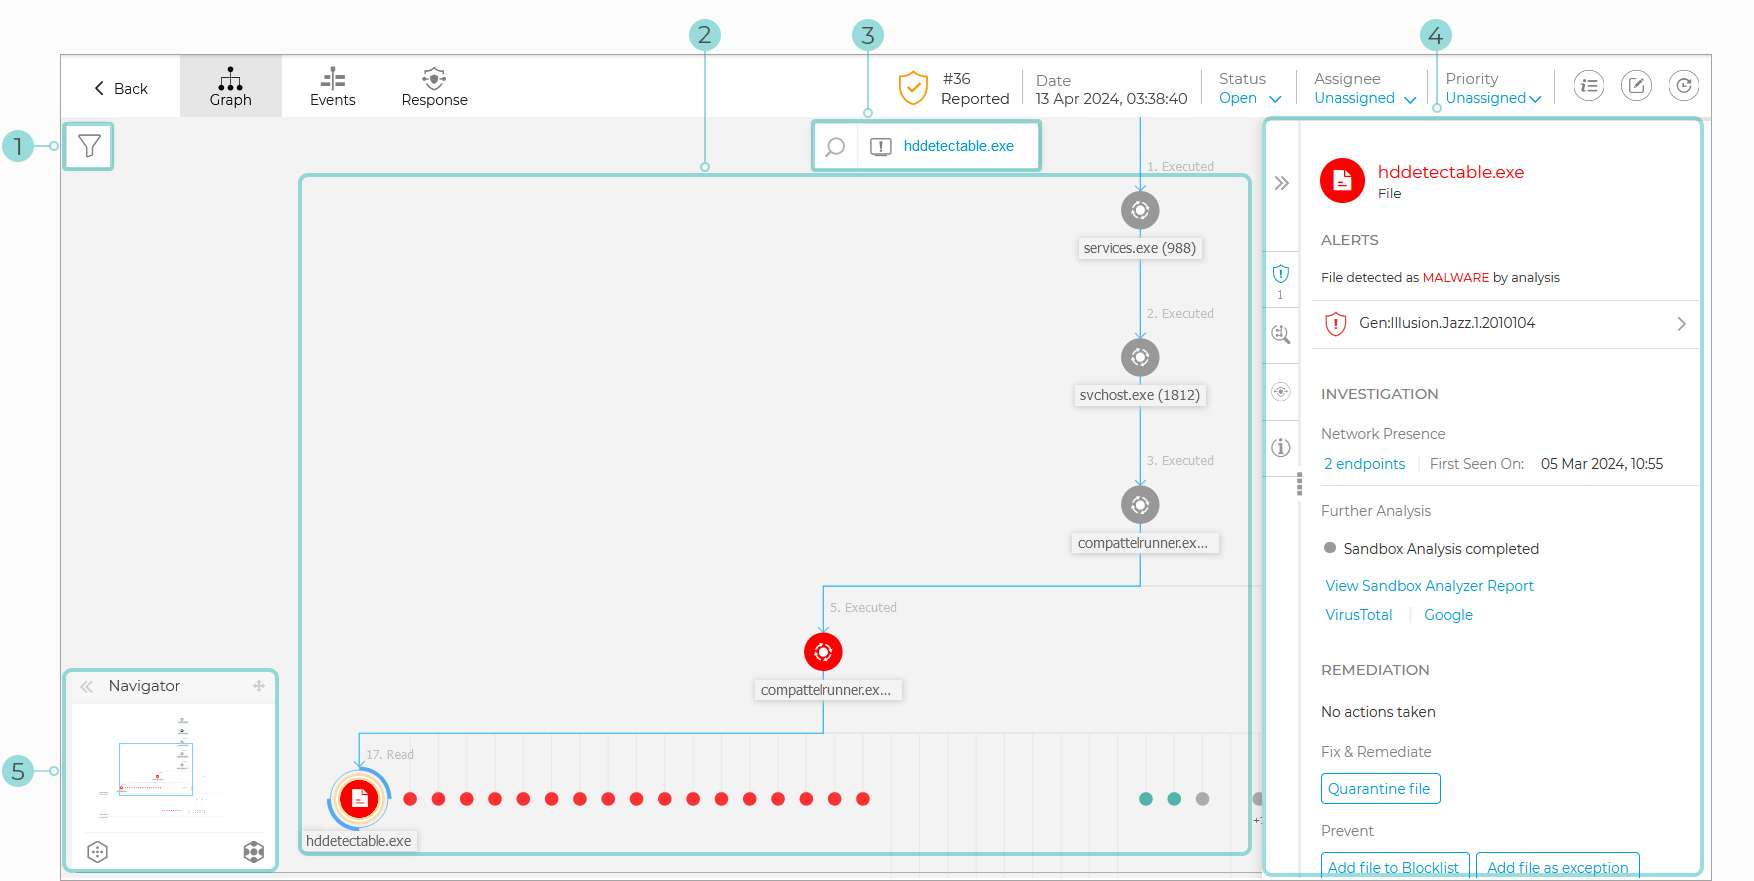
Critical path
The Critical path is the sequence of linked security events that have led up to setting off an alert, starting from the point of entry in the network down to the event node that triggered the incident.
The critical path of the incident is highlighted by default in the graph, along with all consisting event nodes. The trigger node easily stands out from the rest of the elements in the graph, and its info panel is displayed by default alongside the incident graph, providing detailed trigger node information.
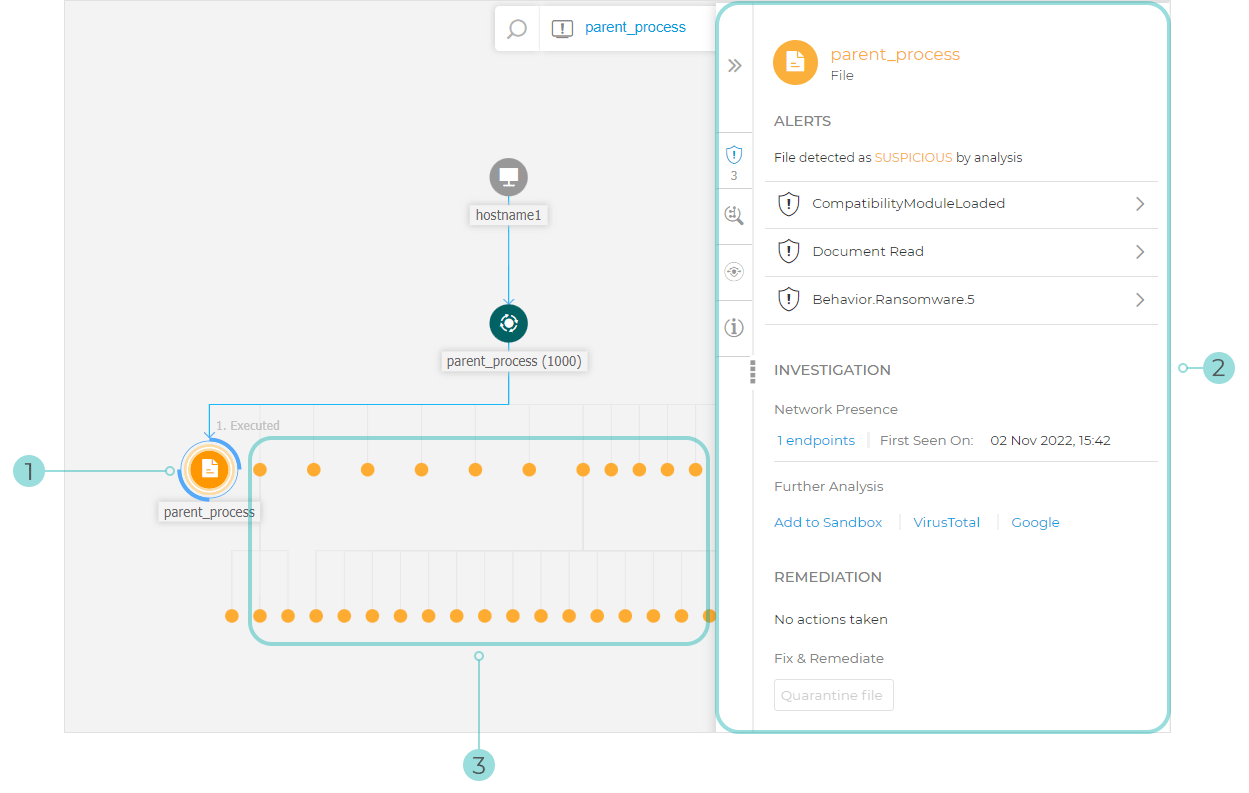
Trigger Node
Node Details panel with collapsible information sections
Minimized nodes, indirectly involved in the incident
Tip
Selecting any other element than the trigger node will no longer highlight the critical path, and show the path to origin instead, from the selected node to the start of the incident.
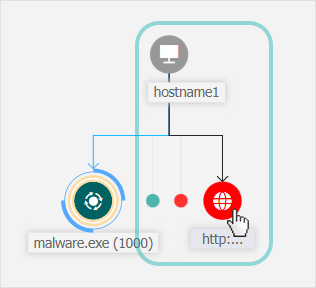
Security event nodes
This is what you need to know about security event nodes:
Each node represents a specific element involved in the investigated incident.
All nodes that make the critical path are shown by default in detail when you open the incident, while the other elements are faded out, to avoid cluttering the view.
Hovering over a node that is not part of the critical path will highlight it and show the path to the point of origin, without breaking the Critical Path.
Three or more same action type event nodes spawning from a parent node are grouped into an expandable cluster-node.
Only nodes without child elements will be hidden from the incident graph when the cluster-node is collapsed.
Nodes where suspicious activity has been detected will not be added to the cluster-node.
Clicking a node will display the following details:
It will highlight in blue the path to the endpoint node along with all the other involved elements.
A side panel with expandable sections that provide detailed information of the selected node, alerts in case detections are triggered, available actions and recommendations.
Nodes are linked by arrow-lines indicating the course of actions that occurred on the endpoint during the incident. Each line is labeled with the action name and its chronological number.
The following elements of an incident can be represented as nodes:
Node type | Description |
|---|---|
Endpoint | Displays endpoint details and patch management status. |
Domain | Shows information about the domain host and its endpoints. |
Process | Shows details about the process role in the current incident, file information, process executions details, network presence and further investigation options. |
File | Shows details about the file role in the current incident, file information, network presence and further investigation options. |
Registry | Displays Registry information and the parent process details. |
Note
Learn more about node details here.
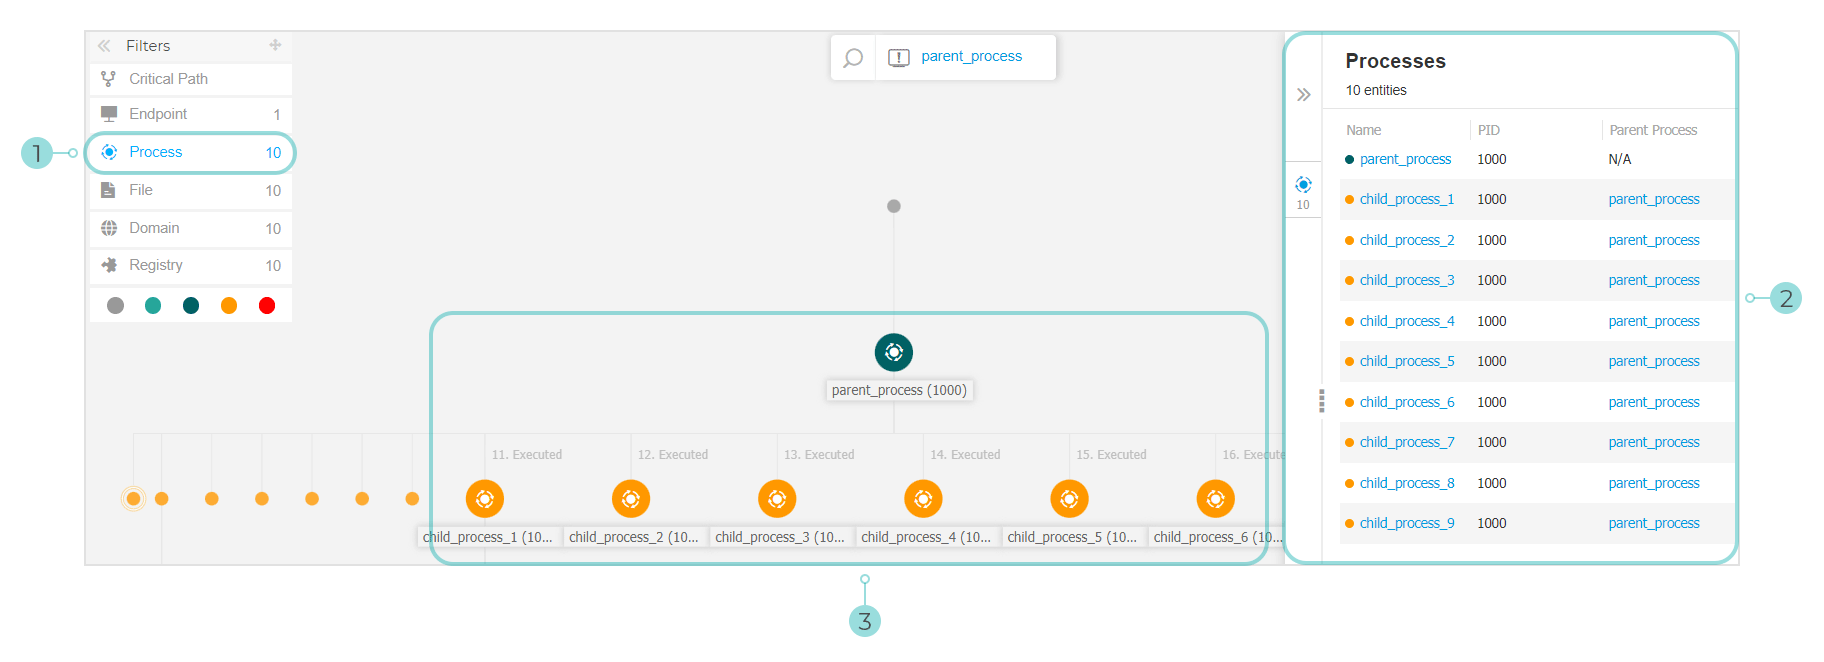
Filters
The Filters menu provides you with enhanced filtering capabilities, allowing full manipulation of the incident graphic, by highlighting the elements based either on their type or relevance, or by hiding them to make the incident more compact and easier to analyze.
Click an hold the Drag icon to position the floating filters panel anywhere inside the incident graph.
When selecting an element-type filter:
The incident graphic zooms out and highlights all the elements of the selected type, while the elements of different type are faded out.
It instantly opens a panel with the list of all the highlighted elements.
Note
Selecting an element from the displayed list will highlight it in the incident graphic, and open a details panel with information related to that element.
Only one filter can be applied at a time.
Filtering options include:
Critical path: It highlights the critical path of the incident of compromise.
Endpoint: It highlights the endpoints affected by the incident.
Process: It highlights all process-type nodes involved in the incident.
File: It highlights file-type nodes involved in the incident.
Domain: It highlights all domain-type nodes involved in the incident.
Registry: It highlights all registry-type nodes involved in the incident.
Element relevance: You can also filter elements by their importance inside the incident.
 Neutral node: Elements with no direct impact in the security incident.
 Important node: Elements with relevant role in the security incident.
 Origin node: Ground zero of the incident inside the network.
 Suspicious node: Elements with suspicious behavior, directly involved in the security incident.
 Malicious node: Elements that caused damage to your network.
You can also hide certain elements from the incident graph by clicking the Show/Hide button displayed when hovering over filters of the type: File, Domain, and Registry.
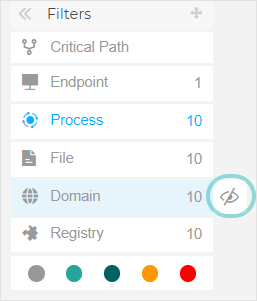
Hiding an element type redraws the incident graph by removing all corresponding elements, even if they are zoomed out, excepting the trigger node and nodes with child elements.
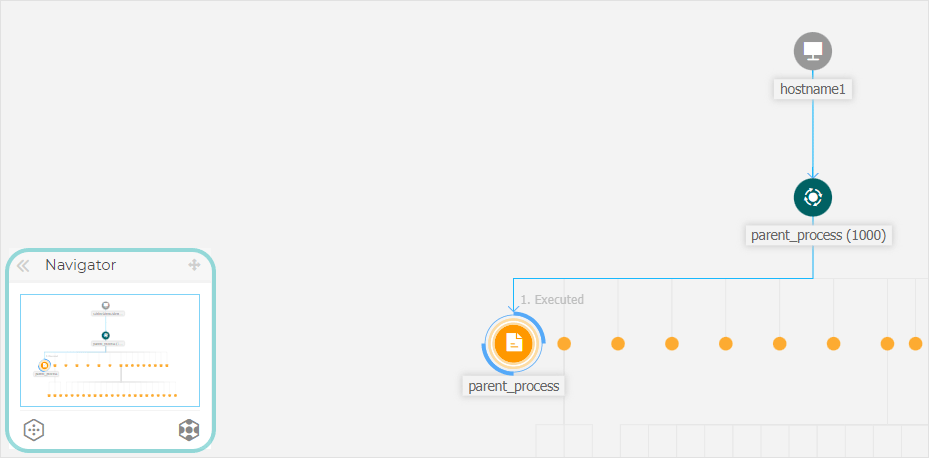
Navigator
The Navigator enables you to quickly move through the incident graph and explore all displayed elements by using the mini-map and the different levels of visualization. The Navigator is collapsed by default. When expanding it, the menu will display the miniaturized version of the entire incident map, and action buttons to adjust the level of visualization.
Click and hold the Drag icon to position the floating navigator panel anywhere inside the incident graph.
The Navigator makes it easy to adjust how you visualize the incident graph, through the use of the  Fewer details and
  More details actions.
Note
In situations when the incident the graph expands beyond screen limits, hold and drag the map selector to the desired incident map area.
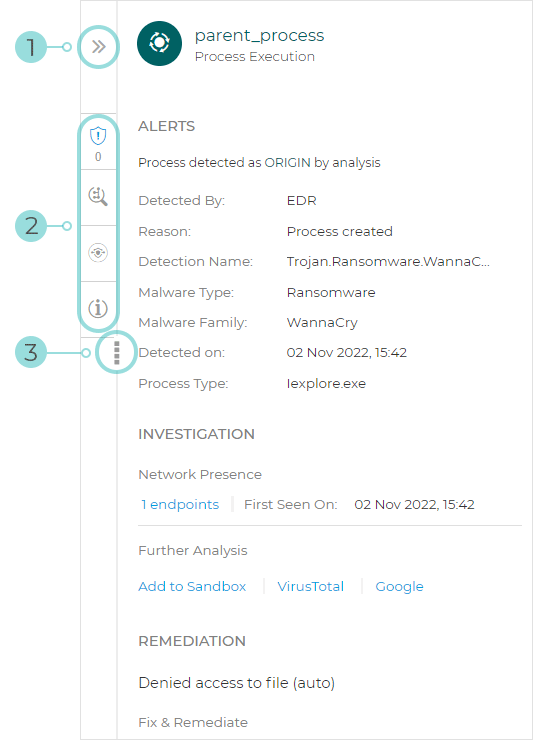
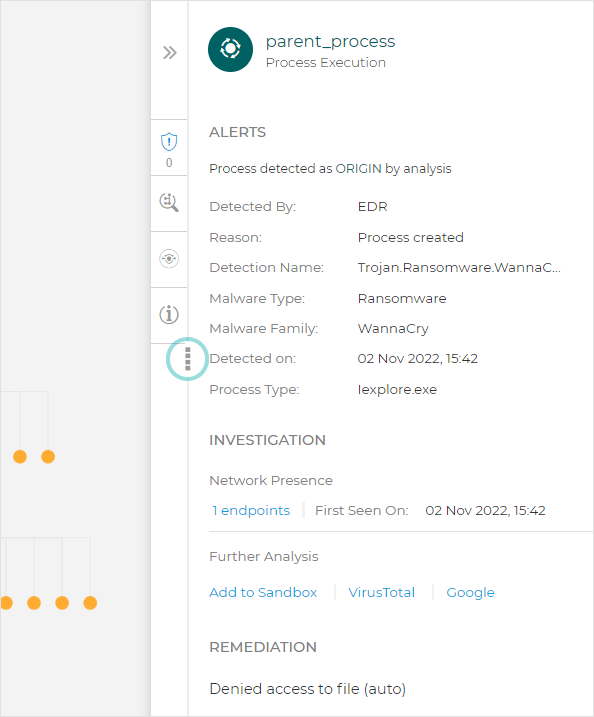
Node details
The Node details panel includes expandable sections with detailed information of the selected node, including preventive or remediation actions you can take to mitigate the incident, details on the type of detection and alerts detected on the node, network presence, process execution details, additional recommendations to manage the security event, or actions to further investigate the element.
To view this information and take actions within the panel, select a node within the security event map.
You can collapse the Node Details panel by clicking the Collapse button.
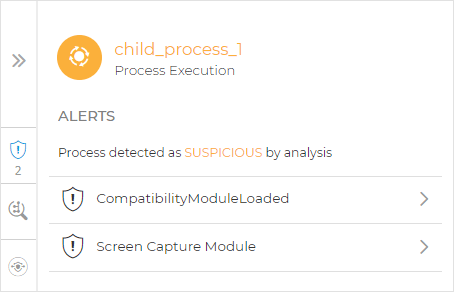
You can easily navigate the information displayed in the Node Details panel by clicking the icons pf each of the four major sections:
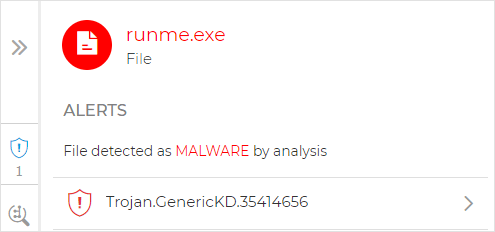
ALERTS. This section displays one or multiple detections triggered on the selected node, including details about the Bitdefender technology that included the element in the incident, the reason that triggered the detection, detection name, and the date when it has been detected.
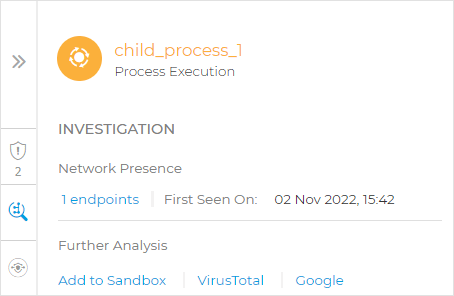
INVESTIGATION. This section displays date stamps for the initial detection and all the endpoints where this element was spotted.
Also, this section provides for the process and network nodes a button that helps you pivot directly into Live Search, where a pre-filled query tailored to the incident context is ready to run.
For the EDR process nodes, click Related processes in Live Search to search for all associated process instances.
For the network nodes, click Related connections in Live Search to check all network connections initiated by the affected endpoint.
REMEDIATION. This section displays actions taken automatically by GravityZone, actions you can take immediately to mitigate the threat, as well as detailed recommendations for each alert detected on the selected node to assist you in mitigating the incident and increase the security level of your environment.
INFO. This section displays general information about each file, and specific information depending on the type of node selected.
You can drag the Node Details panel towards the center of the screen to easily go through its contents.
The Endpoint details panel includes two sections:
REMEDIATION. Displays info about the actions taken automatically by GravityZone to mitigate threats and actions you can take.
Note
The range of actions you can take may vary depending on the license included in your current plan.
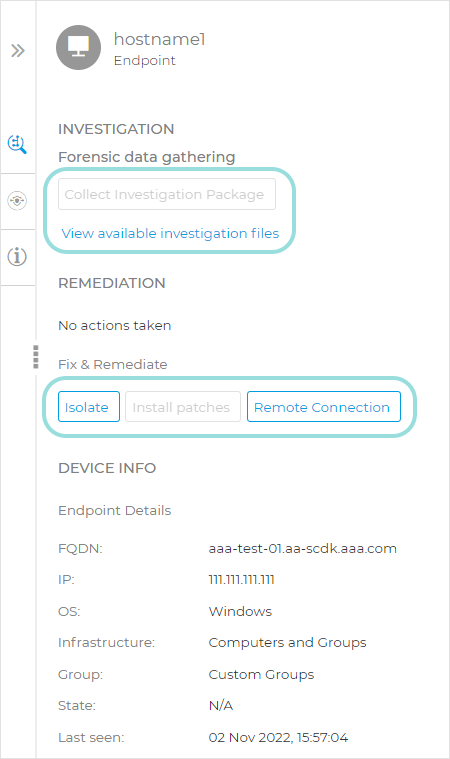
Isolate Host - Use this remediation solution to isolate the endpoint from the network.
Install patches - Use this action to install a missing security patch on the target endpoint. This option is visible only with the Patch Management module, an add-on available with a separate license key. Learn more about installing patches here.
Remote Connection - use this action to to establish a remote connection to the endpoint involved in the current incident and run a number of custom shell commands directly on its operating system, for mitigating the threat instantly or collecting data for further investigation.
Collect Investigation Package - Use this action to start collecting forensic data from the endpoint.
DEVICE INFO. Displays general information about the affected endpoint, such as endpoint name, IP address, operating system, pertaining group, state, active policies, and a link that opens a new window where full endpoint details are displayed.
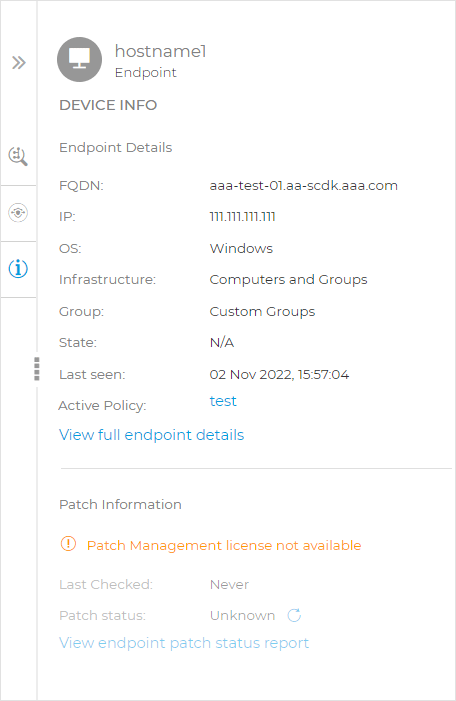
It also provides with information such as the number of installed patches, failed patches, or any missing security and non-security patches.
In addition, you can generate an endpoint patch status report. This section is provided on demand for the target endpoint.
You can take the following actions within the panel:
View patch information for target endpoint. To view patch details, click the Refresh button.
View patch status report for target endpoint. To generate the report, click the View endpoint patch status report button.
The details panel for process nodes includes four sections:
ALERTS. Displays one or multiple detections triggered on the selected node, including details about the Bitdefender technology that included this entity in the incident, the reason that triggered the detection, detection name, and the date when it has been detected. The description for each alert follows the latest MITRE standards.
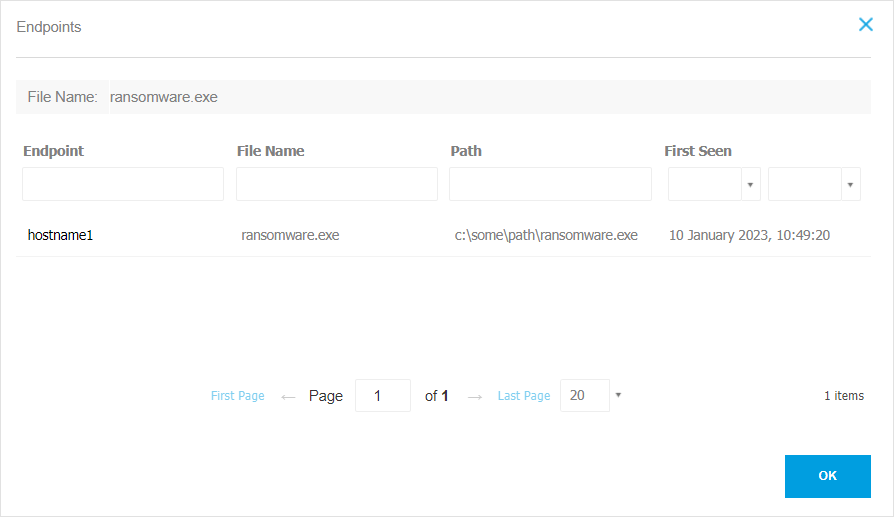
INVESTIGATION. Displays the date stamp for the initial detection and all the endpoints where this threat was spotted.
To view this list, click the number shown in the endpoints field and a new window will pop up.
This section also provides external analysis through internal components and third-party solutions.
The following actions are available:
Add to Sandbox - Use this action to generate a Sandbox Analyzer report.
Choosing Add to Sandbox prompts you with a screen to confirm file submission.
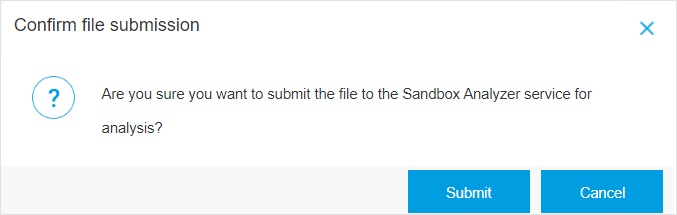
After confirmation, you are automatically redirected to the submission screen.
When the analysis is completed, click the View Sandbox Analyzer Report button to open the full report.
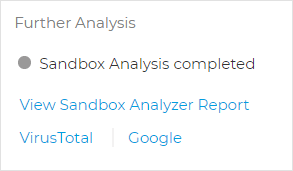
VirusTotal - Use this action to submit a file externally for analysis.
Google - Use this action to search online the hash value of a file.
REMEDIATION. Displays info about the actions taken automatically by GravityZone to mitigate threats and actions you can take.
Note
The range of actions you can take may vary depending on the license included in your current plan.
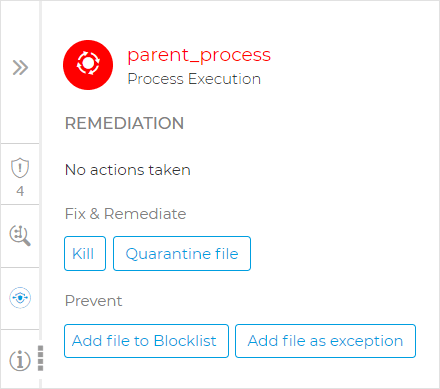
Kill - Use this action to stop a process execution. This action creates a kill process task visible in the process execution bar.
System32and Bitdefender processes are excluded from this action.Quarantine file - Use this action to store the item in question and prevent it from executing its payload. This action requires the Firewall module to be installed on the target endpoint.
Add file to Blocklist - Manage blocked items in the Blocklist page.
Add file as exception - Use this option to exclude legitimate activity on a specific policy. When you choose this action, a configuration window prompts you to select the policy where you want to add an exception. Manage exclusion under Policies > Antimalware > Settings.
This section also provides detailed recommendations for each alert detected on the selected node to assist you in mitigating the incident and increase the security level of your environment.
PROCESS INFO. Displays details about the selected process node, including process name, executed command line, user, time of execution, file origin and path, hash value, or digital signature.
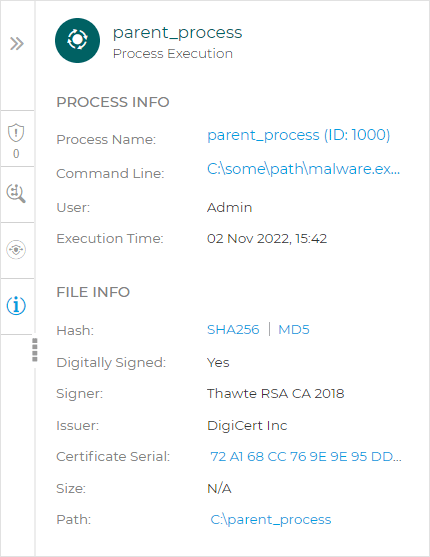
In this section you can copy the item's hash value to clipboard by clicking the available hashing algorithms within the Hash field, and add it to Blocklist.
Note
For more information, refer to Blocklisting files.
The File node details panel includes four sections:
ALERTS. Displays one or multiple detections triggered on the selected node, including details about the Bitdefender technology that included this entity in the incident, the reason that triggered the detection, detection name, and the date when it has been detected. The description for each alert follows the latest MITRE standards. Each alert detected on the selected node provides detailed recommendations to assist you in mitigating the incident and increasing the security level of your environment.
INVESTIGATION. Displays date stamps for the initial detection and all the endpoints where this element was spotted.
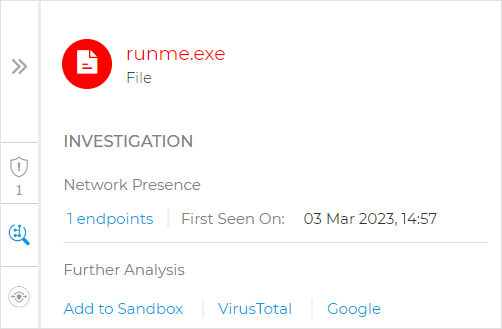
To view this list, click the number shown in the endpoints field and a new window will pop up.
This section also provides external analysis through internal components and third-party solutions.
The following actions are available:
Add to Sandbox - Use this action to generate a Sandbox Analyzer report.
Choosing Add to Sandbox prompts you with a screen to confirm file submission.
After confirmation, you are automatically redirected to the submission screen.
When the analysis is completed, click the View Sandbox Analyzer Report button to open the full report.
VirusTotal - Use this action to submit a file externally for analysis.
Google - Use this action to search online the hash value of a file.
REMEDIATION. Displays info about the actions taken automatically by GravityZone to mitigate threats and actions you can take.
Note
The range of actions you can take may vary depending on the license included in your current plan.
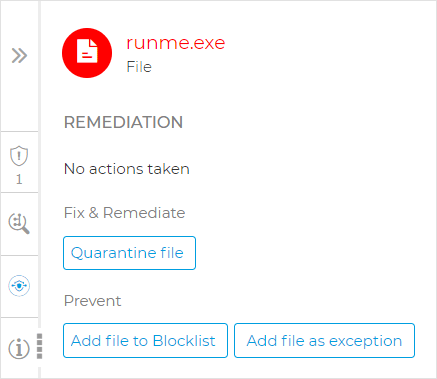
Quarantine file - Use this action to store the item in question and prevent it from executing its payload. This action requires the Firewall module to be installed on the target endpoint.
Add file to Blocklist - Manage blocked items in the Blocklist page.
Add file as exception - Use this option to exclude legitimate activity on a specific policy. When you choose this action, a configuration window prompts you to select the policy where you want to add an exception. Manage exclusion under Policies > Antimalware > Settings.
FILE INFO. Displays details about the selected file node, including file origin and path, hash value, or digital signature.
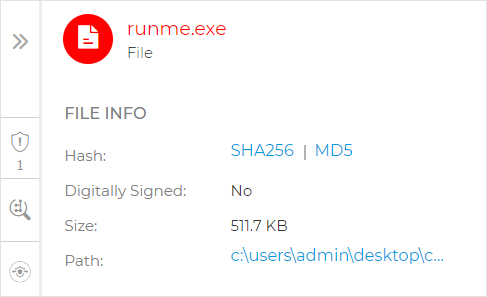
In this section you can copy the item's hash value to clipboard by clicking the available hashing algorithms within the Hash field, and add it to Blocklist.
Note
For more information, refer to Blocklisting files.
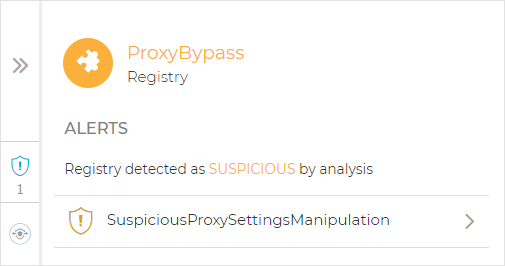
The Registry node details panel includes three sections:
ALERTS. Displays the severity of the registry manipulation as marked by the Bitdefender technology that included this entity in the incident, the reason that triggered the detection, the date when it has been detected, and registry type.
REMEDIATION. Displays info about the actions taken automatically by GravityZone.
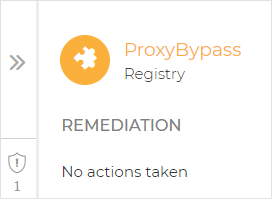
Note
The REMEDIATION section for registry nodes does not provide any user action option.
REGISTRY INFO. Displays details about the selected registry node, including registry key, value and data.
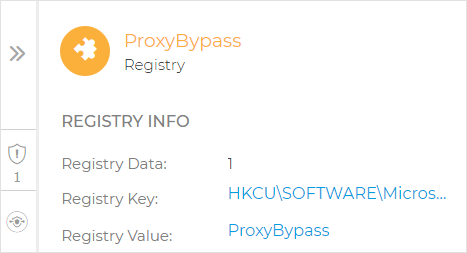
You can click the registry key and value to copy it to clipboard for further analysis purposes.
Search bar
The Search bar has two functionalities:
Search nodes. Click
 and the search bar expands, allowing you to enter information and search the graph for particular nodes.
Incident trigger. A direct link to the node that triggered the alert.
Events
Use the Events tab to view how the sequence of events unfolded into triggering the currently investigated incident. This window displays the correlated system events and alerts detected by GravityZone technologies such as EDR, Network Attack Defense, Anomaly Detection, Advanced Anti-Exploit, or Windows Antimalware Scan Interface (AMSI).
Note
The availability of technologies involved in the detection process may differ depending on the license included in your current plan.
Every event has a detailed description explaining what was detected and what might happen if the artifact is used for malicious purposes, in accordance with the latest MITRE techniques and tactics.
Use the filtering options to display all events, or group them by ATT&CK tactics. You can also use the search bar to find events after predefining their category. The grid is populated with the sorted events.
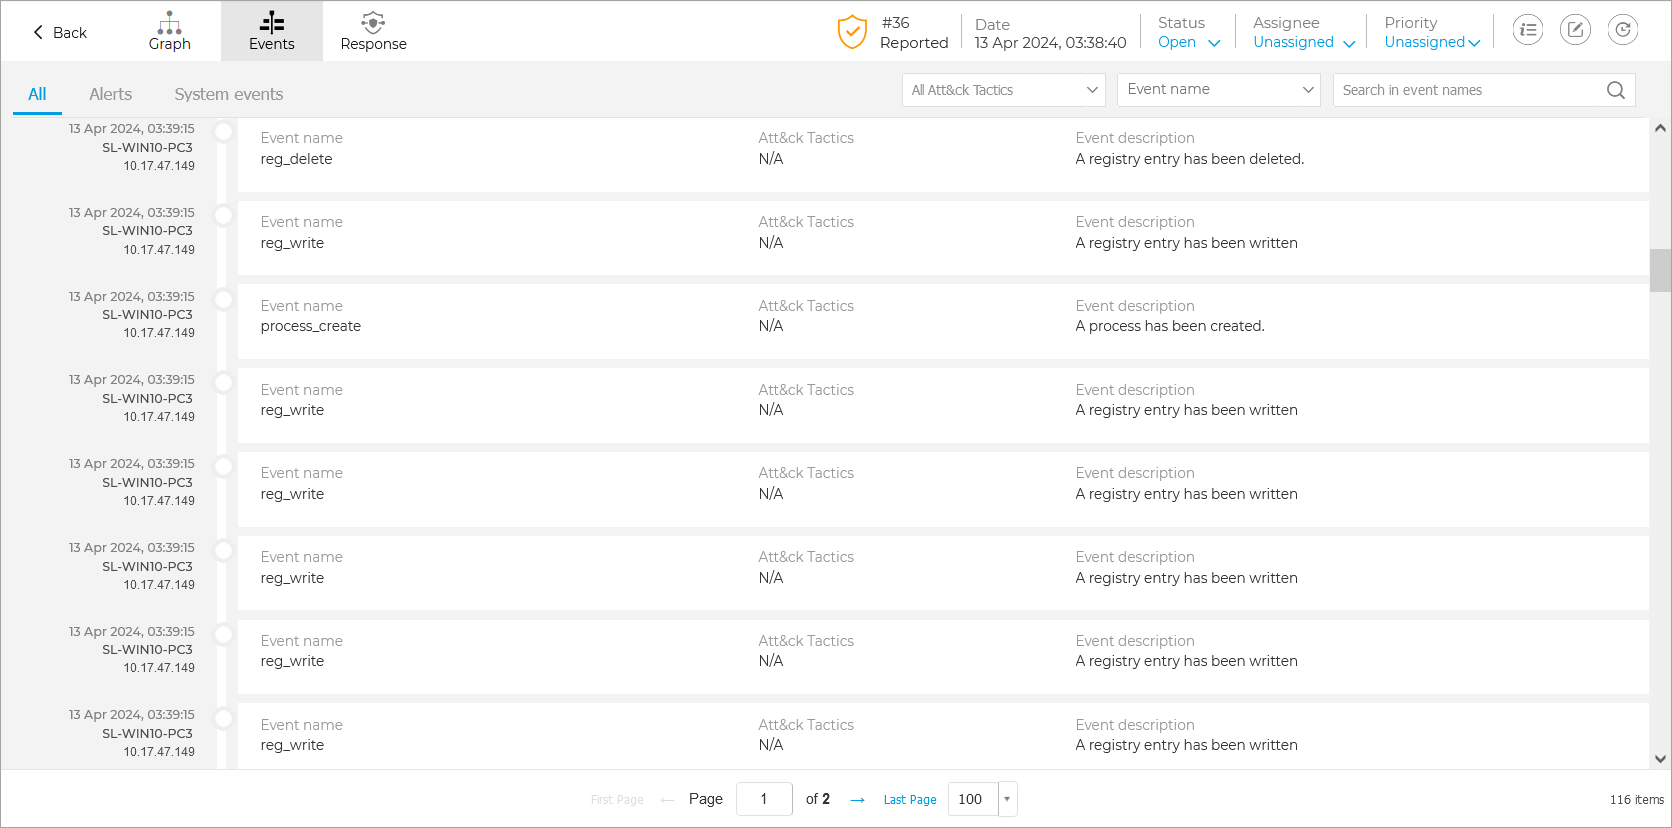
Select any event in the grid to open its side panel and analyze detailed information about the detection, including process activity, affected files, and attack context.
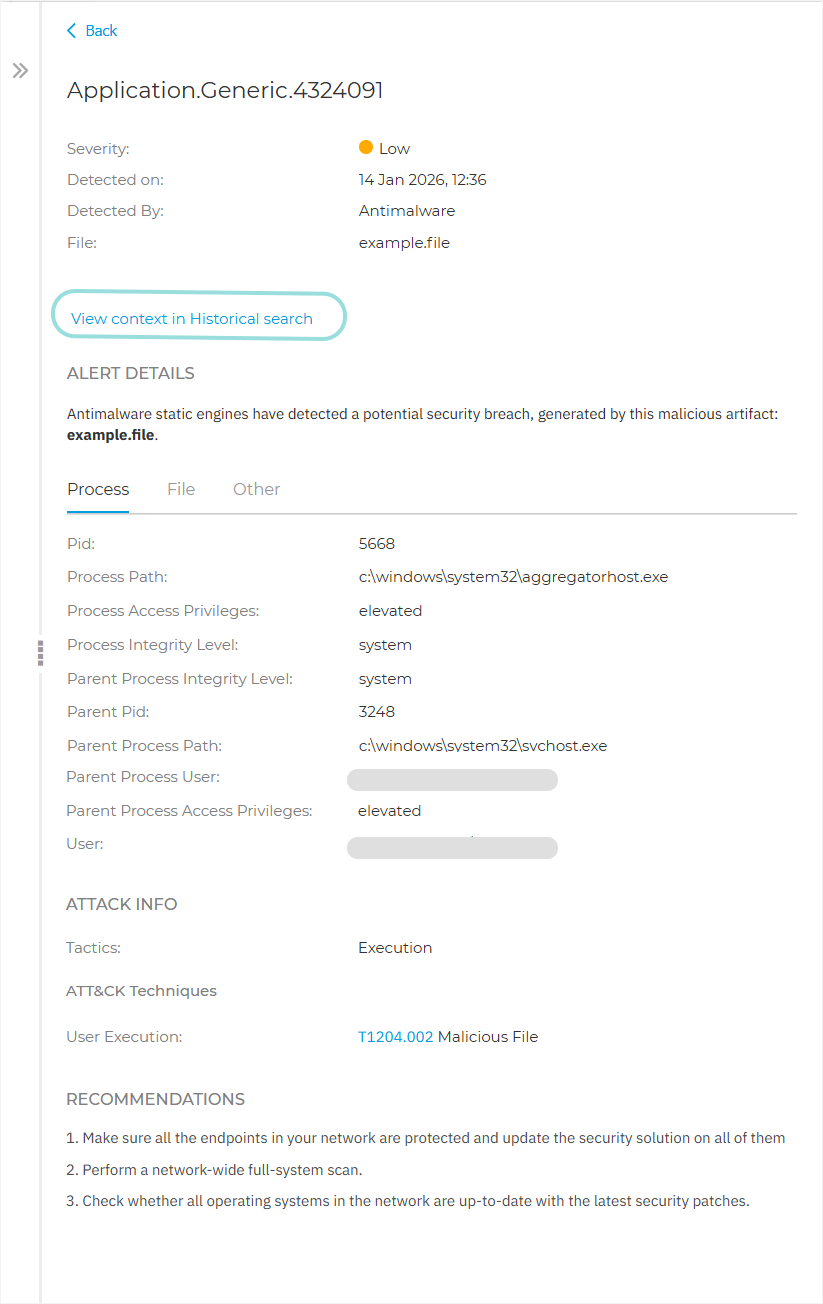
Click View context in Historical search to open Historical search in a new tab and automatically execute a query built from the event context, enabling faster investigation of the event’s origin.
EDR Response
The Response page provides default smart views that you can use to access actions that need immediate attention, pages that display actions that have a specific status, such as In Progress, Completed, or Dismissed, or a list of all Responses that are associated to a specific incident.
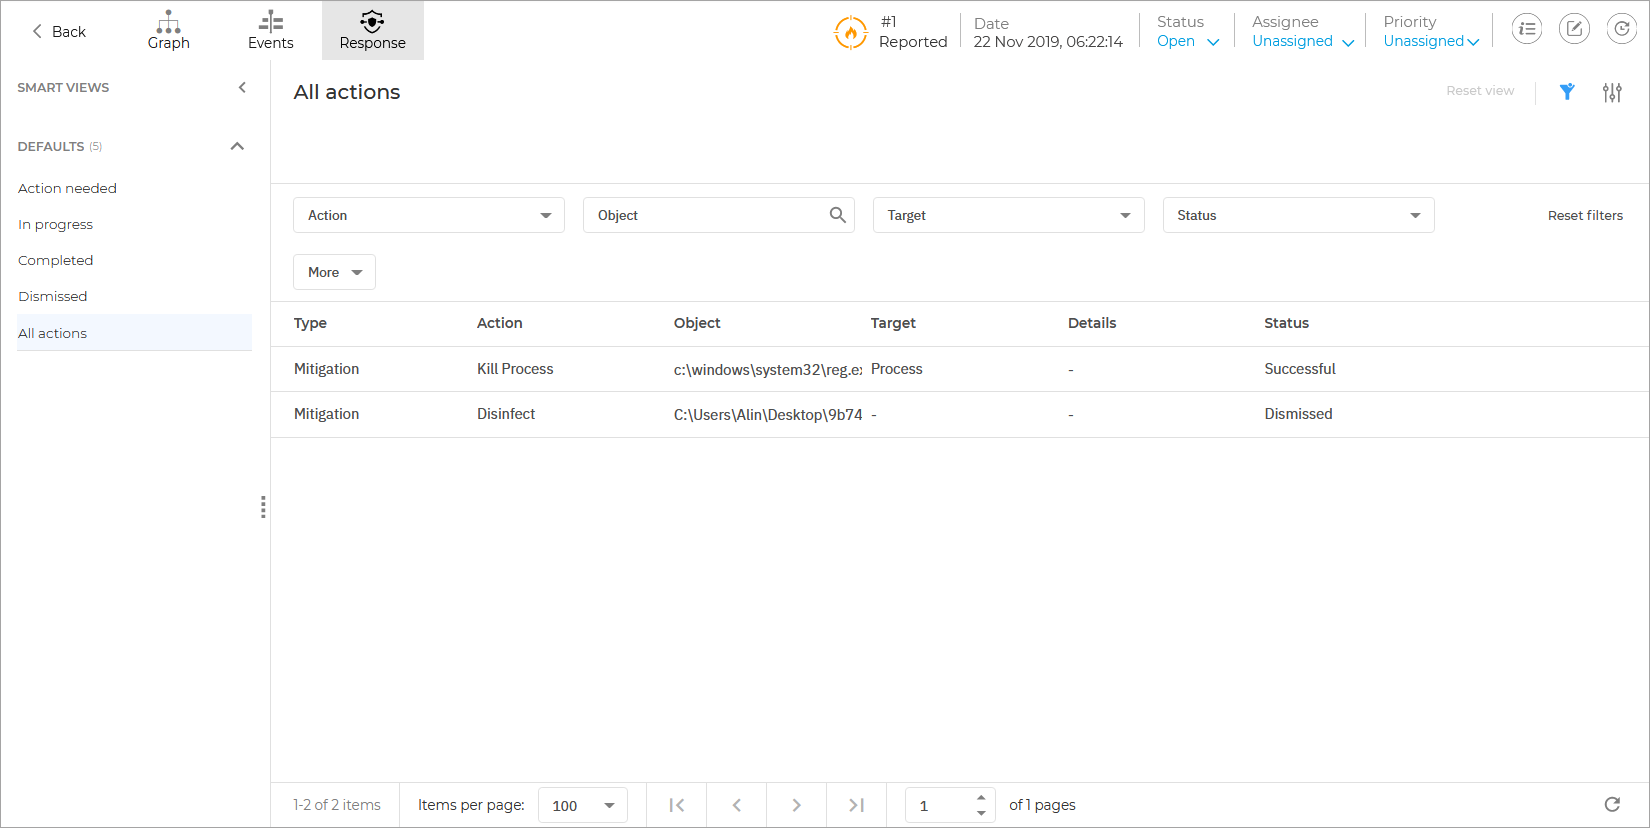
All actions are available in a dynamic grid formation with multiple filtering and sorting options, such as filtering by action type, object, target, status and more.
Multiple columns are available and contain the following information:
Type - The type of action being taken. Possible values:
ContainmentMitigationHardening
Action - The name of the action being taken.
Object - The name of the entity or resource on which the action is being taken.
Note
If the object is an endpoint, the name is a clickable link and will open the Endpoint Details panel.
Target - The type of entity on which an action is taken. Possible values:
EndpointFileProcessRegistry
Details - Provides additional information related to the action being taken.
Executed on - The date when the action was triggered. If the action is the result of an automated response, the date when the endpoint reported it is displayed.
Executed by - Indicates who performed the action.
Source - Indicates where the action originated from.
Incident Info
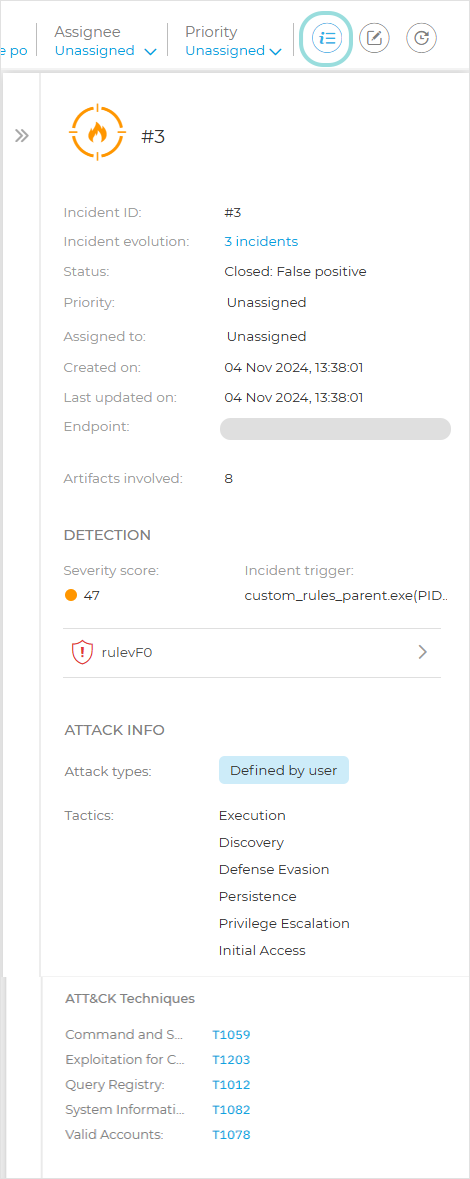
The incident details panel accessed from the incident status bar, from the Incident info button, provides a comprehensive overview of a selected incident, including its identification, status, and key investigation data. It displays essential information such as the incident ID, evolution, status, priority, assignment, timestamps, and affected endpoint.
Important
The Incident evolution field is displayed only when the Create a separate incident when new activity is detected option is enabled in the Settings tab within the company edit workflow. To view details, click the number of incidents. A panel will open displaying all related incidents, their status, and links that you can copy for each one.
The panel also includes details such as severity score, incident trigger, the alerts detected on the incident trigger, and involved artifacts. Additionally, it offers insights into the attack context, including attack types, tactics, and mapped MITRE ATT&CK techniques, helping you quickly understand the nature and impact of the incident.
Incident Status Bar
The incident status bar provides security event tags that can help you detect key information about the involved network endpoints.
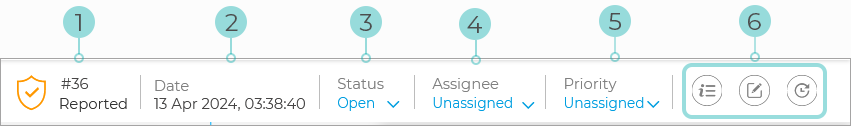
Incident ID - the id number of the incident under investigation and if the incident is either blocked or reported.
Detection timestamp - the date and time the incident was triggered.
Status - the current incident status.
Assignee - the user that the incident is assigned to.
Priority - the priority of each incident.
Access icons and their description:
Notes clipboard
The Notes clipboard provides an easy way to add notes to incidents for tracking changes and incident ownership.
Displaying notes
To display a list of available notes, click the Notes button on the right side of the Status bar:
Note
Alongside each note, the username of its creator will be displayed. If the user belongs to a partner company, the name Partner will be displayed instead.
Adding a note
To add a note, follow the steps below:
Click the Add note button on the lower left side of the clipboard.
Fill in the note information.
Note
Each note can contain up to 50,000 characters.
Select Save.
Note
In case of bulk actions, a single note will be added in bulk for all incidents.
Editing a note
To edit a note, follow the steps below:
Select the Menu button on the right side of the note you wish to edit.
Select Edit.
Make the necessary modifications:
Note
Each note can contain up to 50,000 characters.
Select Save.
Note
If you wish to cancel editing the note, click Cancel, then select Discard.
Deleting a note
To delete a note, follow the steps below:
Select the Menu button on the right side of the note you wish to delete.
Select Delete.
Note
This option is only available for your own notes.
Select Delete again.
History Clipboard
The History panel provides an easy way to track the history of an incident. The following events are tracked:
Status changed
Assigned or reassigned incident
Incident priority set or changed
Incident note added, edited, or deleted
Created incident
Updated incident
The list is displayed in chronological order from newest at the bottom to oldest at the top:
Each event will contain the following information:
The type of the event
A description of the event
The date and time at which the event occurred
Note
The Created event also displays the Severity Score of the incident. The Updated event displays the incident’s new Severity Score, enabling security analysts to spot increases in incident severity that could indicate higher organizational risk.
Some events, such as Assigned, Status changed, and Priority changed, also include details about the user who performed the action.
Remote Connection
Prerequisites
To be able to start a terminal session in a remote connection to an endpoint, ensure that:
The version of Bitdefender agent installed on the endpoint supports the Remote Connection feature.
The endpoint is powered on and online.
The endpoint has Windows OS.
GravityZone can communicate with the endpoint.
Your GravityZone account has manage permissions for the target endpoint.
Starting a remote connection
To access an endpoint via a remote connection, follow these steps:
Go to the Incidents page.
Click the endpoint incident you want to investigate.
In its graph, click the node of the endpoint you need to connect to.
A details panel will be displayed to the right.
Click the Remote Connection button in the details panel.
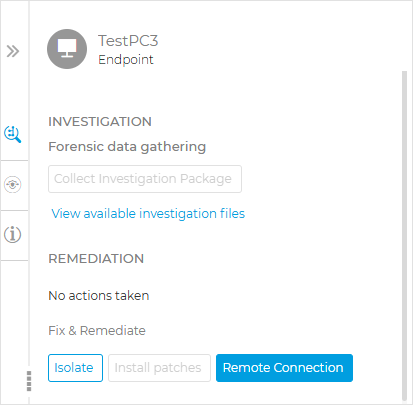
The Remote connection window will be displayed.
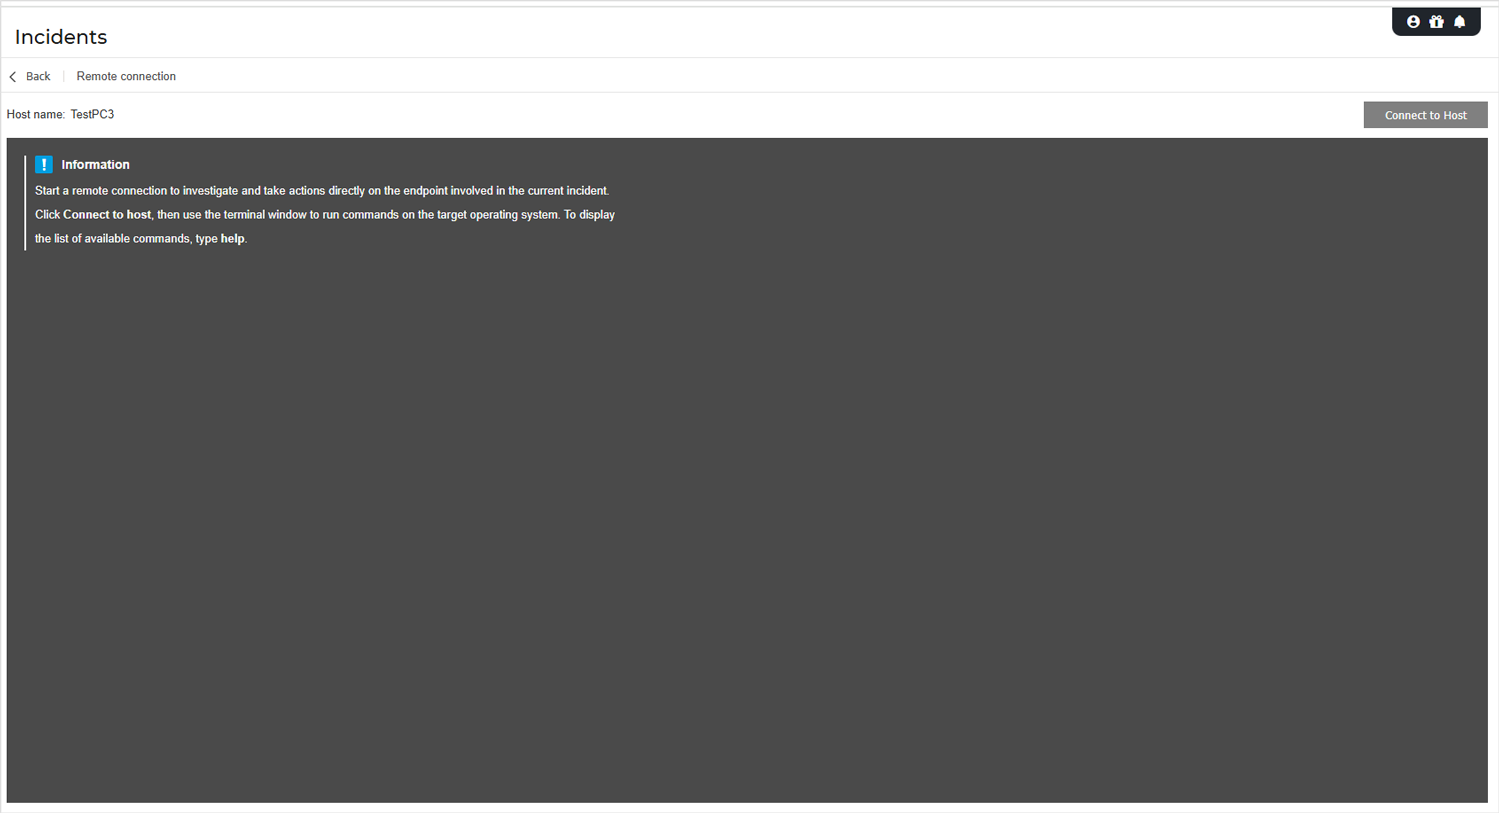
Click Connect to Host to start a remote connection to investigate and take actions directly on the endpoint involved in the current incident.
In the terminal, you can now run several custom shell commands directly on the endpoint's operating system, for removing the threat instantly or collecting data for further investigation.
Start the live session by clicking the Connect to Host button.
The connection status will be displayed next to the endpoint name.
If the connection fails, an error message will be displayed in the terminal window.
Note
You can open maximum five terminal session with the same endpoint simultaneously.
Once connected, the terminal displays the list of available commands and their description.
Type the command that you want in the terminal window followed by
Enter.Note
To learn more about a command, type
helpfollowed by the command name (for example,help ps).The terminal displays the command output, when the command is successful.
If the endpoint fails to complete the command execution, the command will be discarded.
To end the connection, click the End Session button.
The terminal session expires automatically after five minutes of inactivity.
By navigating outside the Remote Connection tab while connected to an endpoint will also end the terminal session.
Terminal Session Commands
EDR terminal session commands are custom-built shell commands, platform independent, using a generic syntax. Find hereinafter the list of available commands you can use on endpoints through the terminal session:
Forensic Data Gathering
Collecting extra information from endpoints affected by an incident is a labor intensive manual task which often disrupts the investigations efforts of a SOC team and generates delay in mitigating and containing threats. The Collect Investigation Package functionality speeds up the process of collecting forensic evidence the environments of any of your managed companies by bypassing the need to directly interact with the endpoint involved in an incident.
Note
In order to access the Collect Investigation Package functionality for your managed companies, the same requirements apply.
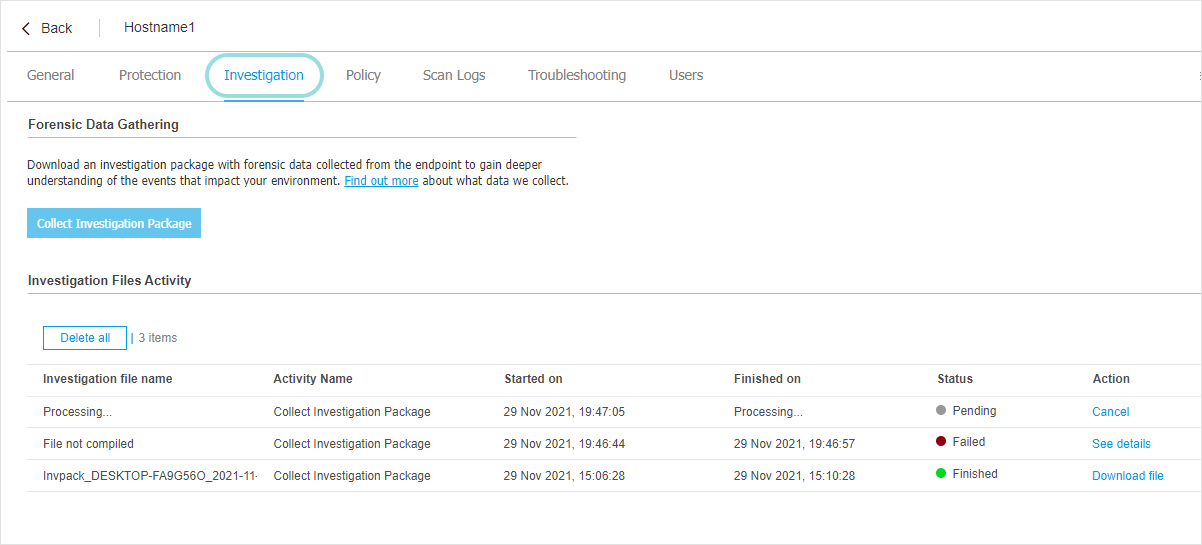
This feature is compatible with the following operating systems:
Windows
Linux
Mac
Investigation package prerequisites
To start a the collection of forensic data from an endpoint you have to meet the following criteria:
Your company must have an active EDR or XDR license
The GravityZone user account must have the Manage Networks right enabled. For more details, refer to User rights.
Users logging in with GravityZone credentials need to have two-factor authentication (2FA) enabled. Users logging in via single sign-on (SSO) integrations with 3rd parties do not require 2FA to access the feature.
The target endpoint must be powered on and online.
Collecting an investigation package
You can collect an investigation package using different approaches, based on your tasks, either by selecting an endpoint that is part of a XDR incident, or by selecting a managed endpoint from your Network inventory.
In the Incidents page, select from the grid the extended or endpoint incident you want to investigate further and open the Graph view.
In the Graph, select the node of the endpoint involved in the incident and click Collect Investigation Package to start compiling an archive with forensic data.
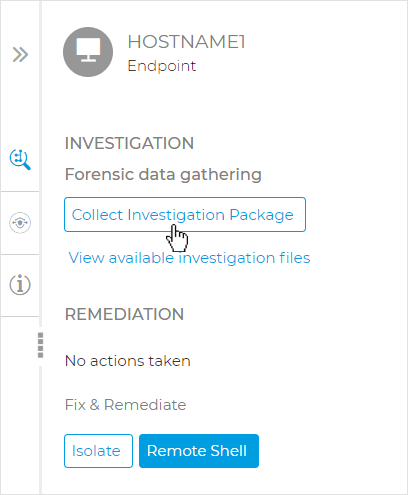
Note
If the button is inactive, a tooltip will be displayed, with the reason why the action is unavailable. For more details see Investigation package prerequisites
A toast message will inform you that the data collection request was successfully created.
Click the View available investigation files link to access the full endpoint details page and track its progress.
You can view the current collection process (the status of the activity in progress is set to Pending), along with other data gathering activities performed in the past 24 hours.
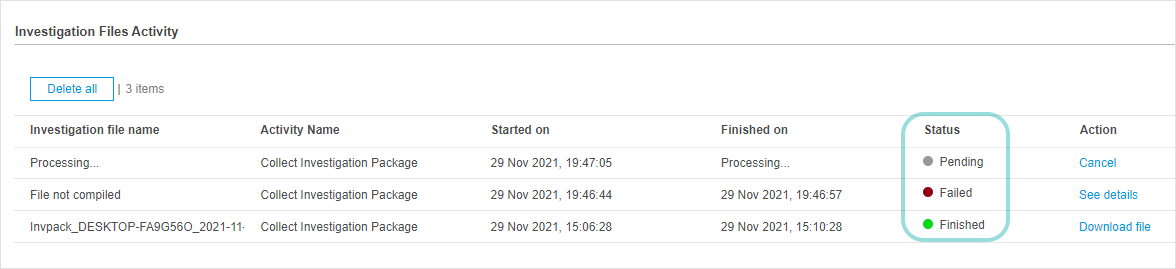
Note
Collection activities that were canceled by user or could not be completed for various reasons have the status set to Failed .
When the data collection process has completed successfully, the action status changes to Finished, and the archive with collected forensic artifacts is available for download.
Click Download file in the Actions column to download the archive locally and analyze the collected data.
Note
To find out more details about the type of data collected as part of an investigation package see Investigation Package data.
In the Network page, select the managed endpoint you want to collect forensic data from and open its details page.
Go to the Investigation tab, and click Collect Investigation Package to start compiling an archive with forensic data.
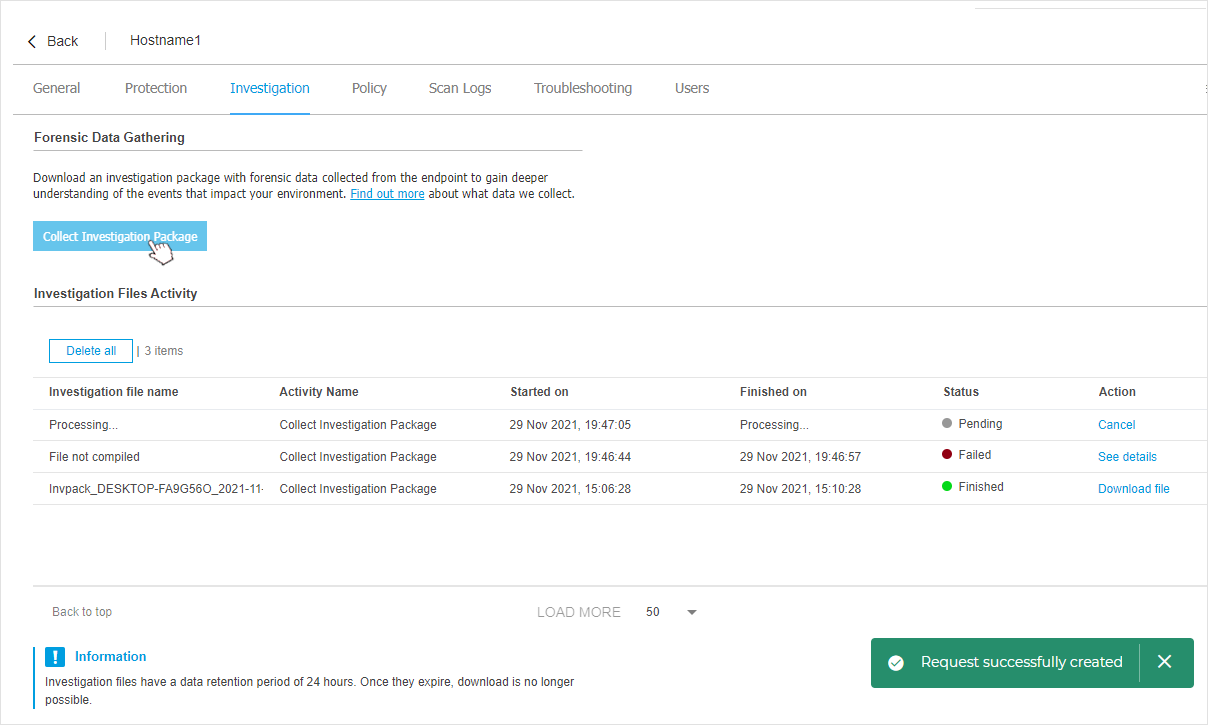
Note
If the button is inactive, a tooltip will be displayed, with the reason why the action is unavailable. For more details see Investigation package prerequisites
A toast message will inform you that the data collection request was successfully created.
You can track its progress in the Investigation Files Activity grid.
You can view the current collection process (the status of the activity in progress is set to Pending), along with other data gathering activities performed in the past 24 hours.
Note
Collection activities that were canceled by user or could not be completed for various reasons have the status set to Failed .
When the data collection process has completed successfully, the action status changes to Finished, and the archive with collected forensic artifacts is available for download.
Click Download file in the Actions column to download the archive locally and analyze the collected data.
Note
To find out more details about the type of data collected as part of an investigation package see Investigation Package data.
Searching security events
Historical search
Overview
The Search > Historical tab allows you to find past security events through complex search criteria. You can select which events GravityZone processes by going to Configuration > Raw Events.
The tab contains the following main areas:
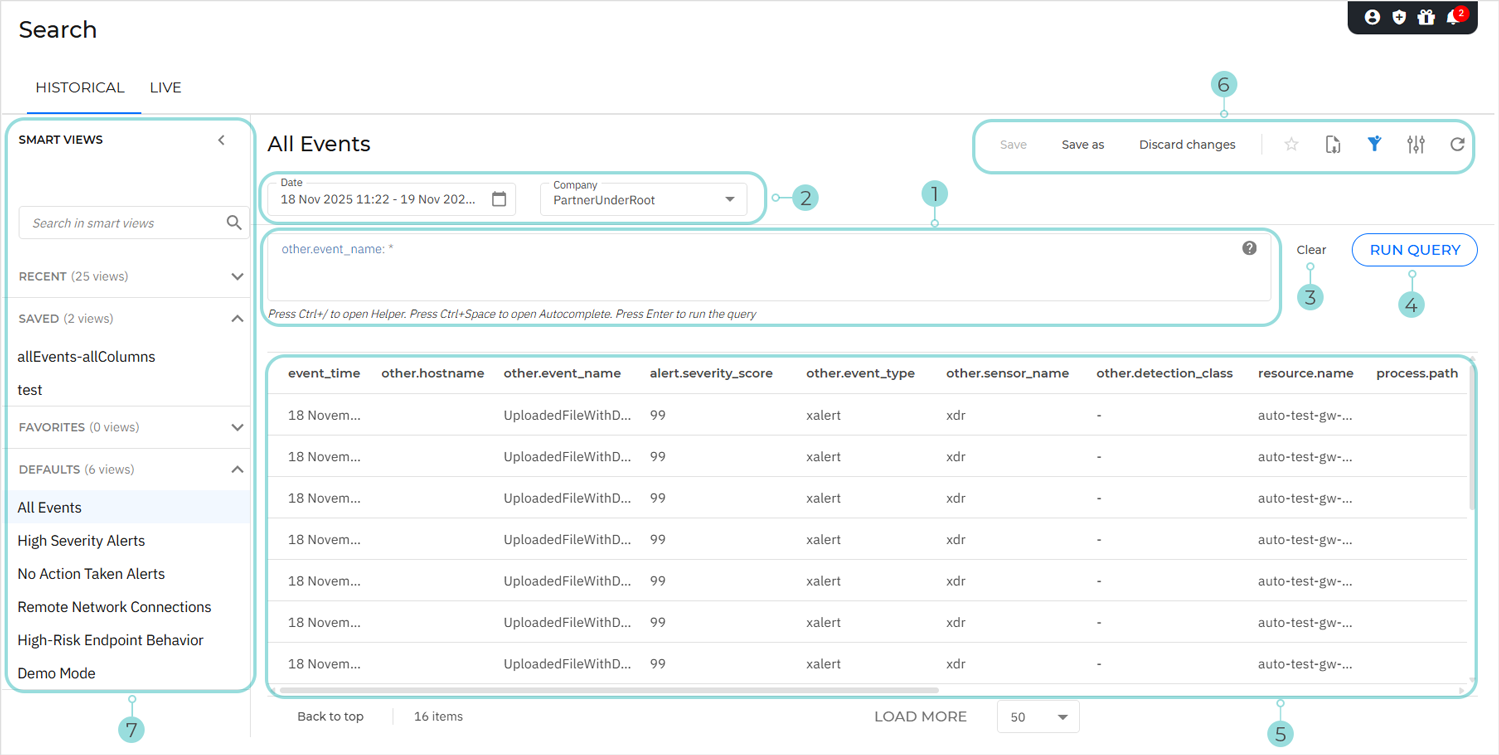
The query editor: here you can build queries using the available suggested fields and the rules available on the The XDR query language page.
The Filters section: you can adjust these options to specify the company and the time range of the events displayed.
The Clear button: removes all text from the query editor.
The Run query button: executes the query built in the query editor.
The customizable table: displays query results. Columns can be resized and reordered as needed.
Note
The table retains the last used smart view across sessions. When you open the Historical > Search tab again, the previous results are restored.
The View options menu: This section provides you with multiple functionalities for working with smart views:
Save as: saves a modified smart view under a different name, as either a shared or private view.
Save: saves changes to a smart view you created or to a shared smart view you have permissions to edit.
Discard changes: reverts the smart view to the last saved version.
Add to favorites: adds the saved smart view to the Favorites category.
Export view: exports the query results table as a CSV file.
Hide filters (or Show filters): Hides or displays the time frame and company filters.
Open settings: displays the Settings panel. You can use this panel to customize what columns are displayed in the view and enable or disable the Compact view.
Refresh data: refreshes the query results.
The Smart views panel: stores query results and customized table configurations. Views are grouped into five categories, so you can easily browse and switch between them:
Recent: your last 25 executed queries
Saved: all your customized smart views that are saved and not shared with other users
Favorites: all saved smart views that were added to favorites
Defaults: predefined queries that illustrate how to use different XDR query language capabilities
Six default smart views are available:
All Events
High Severity Alerts
No Action Taken Alerts
Remote Network Connections
High-Risk Endpoint Behavior
Demo Mode
Note
Demo Mode offers a set of simulated events that enable you to test Historical search functionalities, even if no data is available from your endpoints.
Shared: all smart views shared company-wide by you or other users, with either read-only or edit permissions
Important
This category is visible only if at least one smart view has been shared across the company.
The search bar at the top of the panel can be used to find a smart view by its name. Search in smart views does not support wildcards.
Running queries
To run a query:
Type the query string in the query editor. Suggestions for field names, values, and operators appear as you type.
Tip
For suggestions regarding field names, open the Helper by pressing CTRL + /.
For suggestions regarding values, open the Autocomplete by pressing CTRL + Space.
For help regarding fields available or syntax, use the Syntax Help.
You can use nested queries to build complex searches.
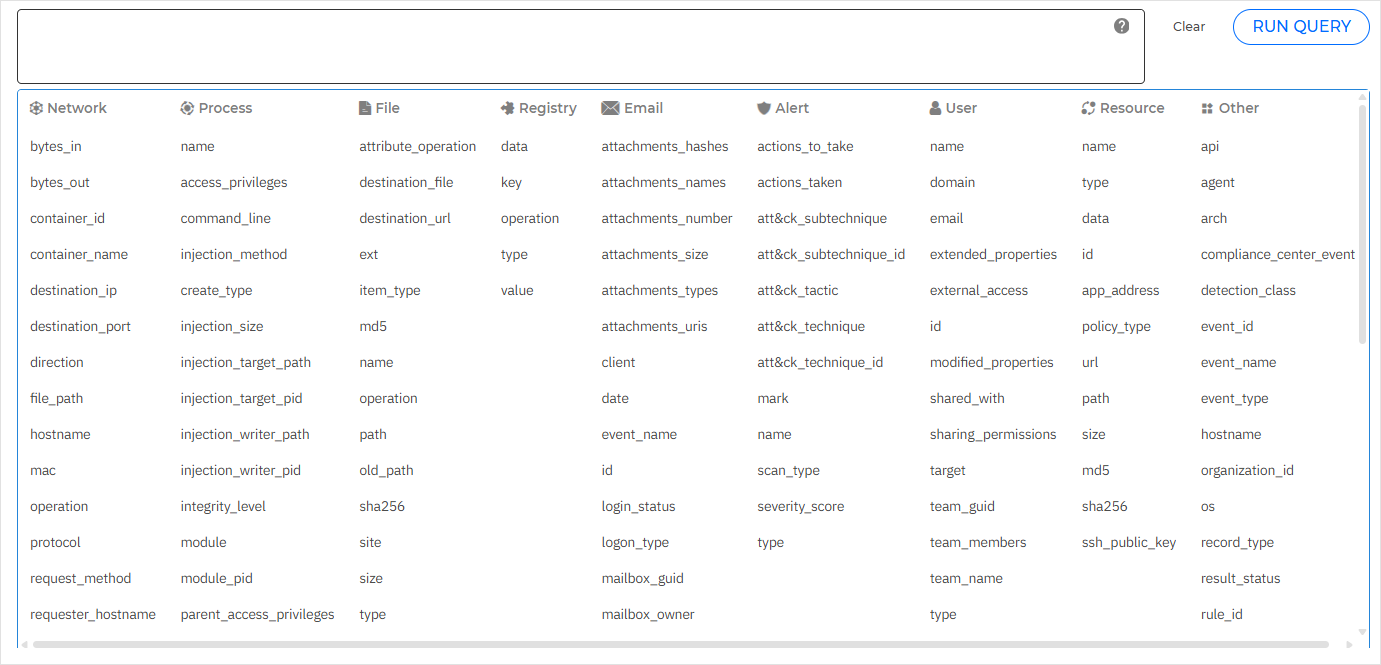
Set up the time frame using the Date filter:
Click the filter.
Specify the search time frame:
To define a specific date range, select Custom, then select the start and end dates from the calendar. Alternatively, you can use one of the predefined intervals: Last 24 hours, Last 7 days, Last 30 days.
Set the exact hour and minute for both the start and end dates using the From and To time selectors.
Important
Raw events and EDR/XDR alerts have different default retention periods: 3 days and 90 days, respectively. You can extend this period. For complete information, refer to the Retention policies page.
Click Apply .
Select the company whose events you want to display. You can choose your own company or any managed company.
Click Run query.
The query results will be displayed in the customizable table.
Important
GravityZone Control Center can display up to 10,000 events.
If the query result contains more than 10,000 events, a message pops up, and you need to refine your search.
Refining your search
If the initial query returned too many results, you can optimize your search criteria. You can manually add information in the query editor, or you can use the event details panel. To refine your search using the panel, follow these steps:
Select any event in the results table to open the details panel.
In the Table tab, click the
 search icon at the end of the field you want to add in the query.
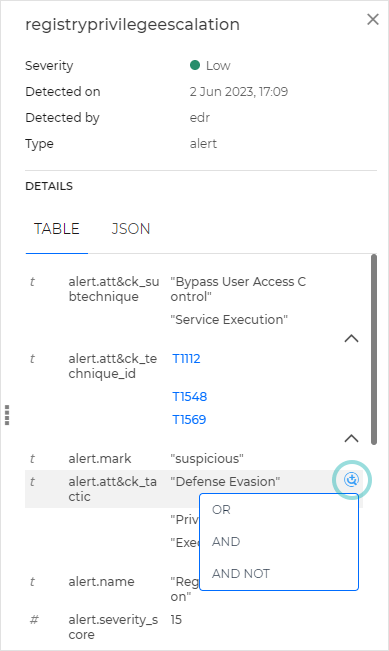
Select the necessary operator.
The field-value pair will be added in the query editor.
Select Run query.
The refined query results will be displayed in the customizable table.
Note
The event details panel also contains the JSON tab. This tab is displayed only for EDR and XDR alerts, identified through the following key-value pair:
other.event_type: alertfor EDR alertsother.event_type: xalertfor XDR alerts
It contains further information related to that specific alert. You cannot refine your search from this tab, but you can copy all data by clicking Copy to clipboard. For a detailed list of all available JSON fields, refer to JSON fields.
Smart views
The Historical search feature offers the ability to save smart views for later use.
You can also share, edit, delete, or rename previously saved smart views.
Saving new smart views
To save a new smart view, follow these steps:
Run the desired query by following the steps described in the Running queries section.
Optional: You can customize the results table either by rearranging and resizing columns or by opening the Settings panel and configuring column visibility.
Click the Save As button in the upper-right corner of the page.
The following dialog box is displayed:
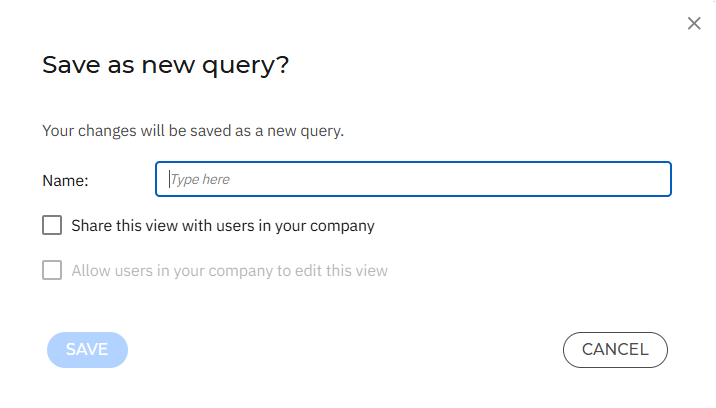
Type a name for your smart view.
Optionally, select Share this view with users in your company. This option makes the smart view visible to other users in read-only mode.
Optionally, if you completed the previous step, you can now select Allow users in your company to edit this view. This option allows other users to modify the smart view.
Important
All changes made to an editable shared view are propagated to all users in the company.
Users working on the same shared view are notified if it has been changed or deleted by someone else.
Click Save.
After saving:
If the view is not shared, it is added under the Saved category.
If the view is shared, it is added under the Shared category.
Note
When a shared view is accessed, the following information is displayed next to its title:
Type (read-only or editable)
The user who created the view
The last update date and time
The user who last saved the view
The Save as functionality includes table customizations, such as column rearrangement, resizing, and visibility settings defined in the Settings panel.
Sharing personal smart views
To share a personal smart view:
In the left-side panel, go to the Saved category.
Click the corresponding three-dot icon to open the menu.
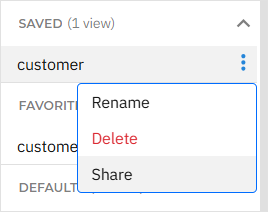
Click Share.
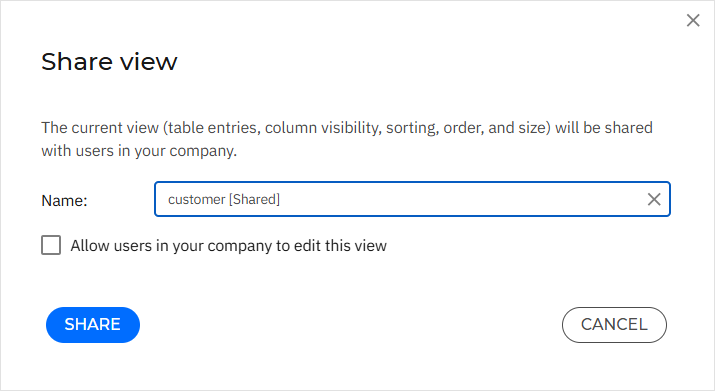
In the configuration window, optionally change the name.
Note
By default, the suffix
[Shared]is added to avoid naming conflicts with your personal smart view. You can modify the name as needed.Optionally, select Allow users in your company to edit this view to make the view editable by other users.
Click Share.
The smart view is added under the Shared category.
Note
Sharing a smart view is recorded in the User activity section under:
Area: Historical Search
Action: Created
Making shared views editable
If you shared a smart view as read-only, you can make it editable:
In the Smart views panel, go to the Shared category.
Click the corresponding three-dot icon to open the menu.
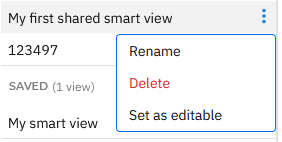
Click Set as editable.
The following dialog box may be displayed:
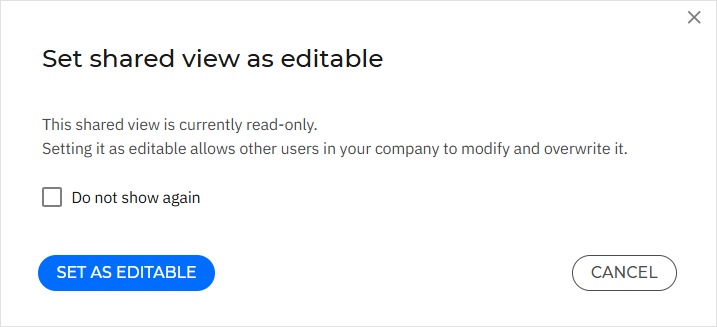
Optionally, select Do not show again to prevent this box from appearing when making shared smart views editable in the future.
Click Set as editable.
The shared view becomes editable to all users in your company.
Important
As a Company Administrator, you can set all shared smart views across the company as editable. As a non-admin user, you can set as editable only those shared smart views you created.
Setting a shared view as editable is recorded in the User activity section under:
Area: Historical Search
Action: Edited
Editing saved smart views
To edit a saved smart view, follow these steps:
Select the smart view from the Saved, Favorites, or Shared section of the Smart views panel.
The results table will be displayed.
Make the necessary changes to your smart view. You can edit the query in the query editor or customize the table, for example by rearranging columns.
Click the Save button in the upper-right corner of the page.
If the smart view you are editing is shared, the following dialog box may be displayed:
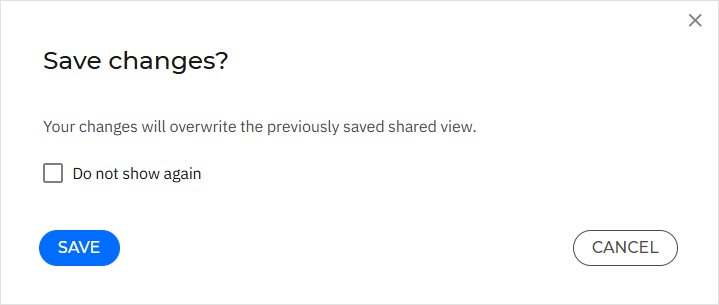
Optionally, select Do not show again to prevent this box from appearing when editing shared smart views in the future.
Click Save.
Important
The Save functionality includes table customizations, such as column rearrangement, resizing, and visibility settings defined in the Settings panel.
Recent and default smart views are read-only. To preserve any edits, you must save them as new smart views.
As a Company Administrator, you can edit all shared smart views across the company. As a non-admin user, you can edit only those shared smart views you created or have edit permissions for.
Editing a shared view is recorded in the User activity section under:
Area: Historical Search
Action: Edited
Deleting saved smart views
To delete a saved smart view, follow these steps:
In the Smart views panel, click the
vertical ellipsis next to the smart view you want to delete.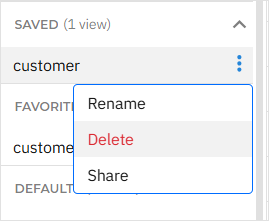
Select Delete.
Click Delete to confirm your choice.
Important
Only saved, favorite, and shared smart views can be deleted.
Company Administrators can delete any shared smart view across the company, while non-admin users can delete only the ones they created.
Shared smart views are deleted for all users.
If a shared view is deleted while another user is editing it, that user is notified when attempting to save.
Deleting a shared view is recorded in the User activity section under:
Area: Historical Search
Action: Deleted
Renaming saved smart views
To rename a saved smart view, follow these steps:
In the Smart views panel, click the
vertical ellipsis next to the smart view you want to rename.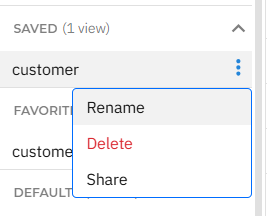
Select Rename.
Type a new name for your smart view.
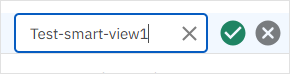
Click the
 Checked icon to confirm your action.
Important
Only saved, favorite, and shared smart views can be renamed.
Changes to a shared smart view name are visible to all users.
Company Administrators can rename any shared smart view across the company, while non-admin users can rename only the ones they created.
Renaming a shared view is recorded in the User activity section under:
Area: Historical Search
Action: Renamed
Live Search
Overview
With Live Search you can retrieve information about events and system statistics directly from online endpoints using Osquery, an operating system instrumentation framework that uses the SQLite query language.
Note
For more information on Osquery, check the official documentation following the links below:
Prerequisites
Before using Live Search, make sure the following requirements are met:
For secure communication between GravityZone Control Center and the endpoint, the target endpoint's corporate firewall allows traffic to DigiCert servers.
Important
A firewall rule might need to be configured to allow the required communication. Examples of web addresses the rule should whitelist:
http://crl3.digicert.comhttp://crl4.digicert.comhttp://ocsp.digicert.com
Network access to DigiCert servers is required for the automatic download of certificate revocation lists, which are used to verify the GravityZone server certificate.
No custom certificates need to be provided. Endpoints automatically use the DigiCert-signed ones.
If the company of the target endpoint uses MITM solutions that decrypt traffic or perform certificate pinning between endpoints and GravityZone, outbound access on port 443 to the following GravityZone service endpoints is allowed:
cloud-wbs-endpoints.gravityzone.bitdefender.comcloudap-wbs-endpoints.gravityzone.bitdefender.comcloudgz-wbs-endpoints.gravityzone.bitdefender.com
The Live Search option is enabled in the target endpoint's policy, under the Live Search section.
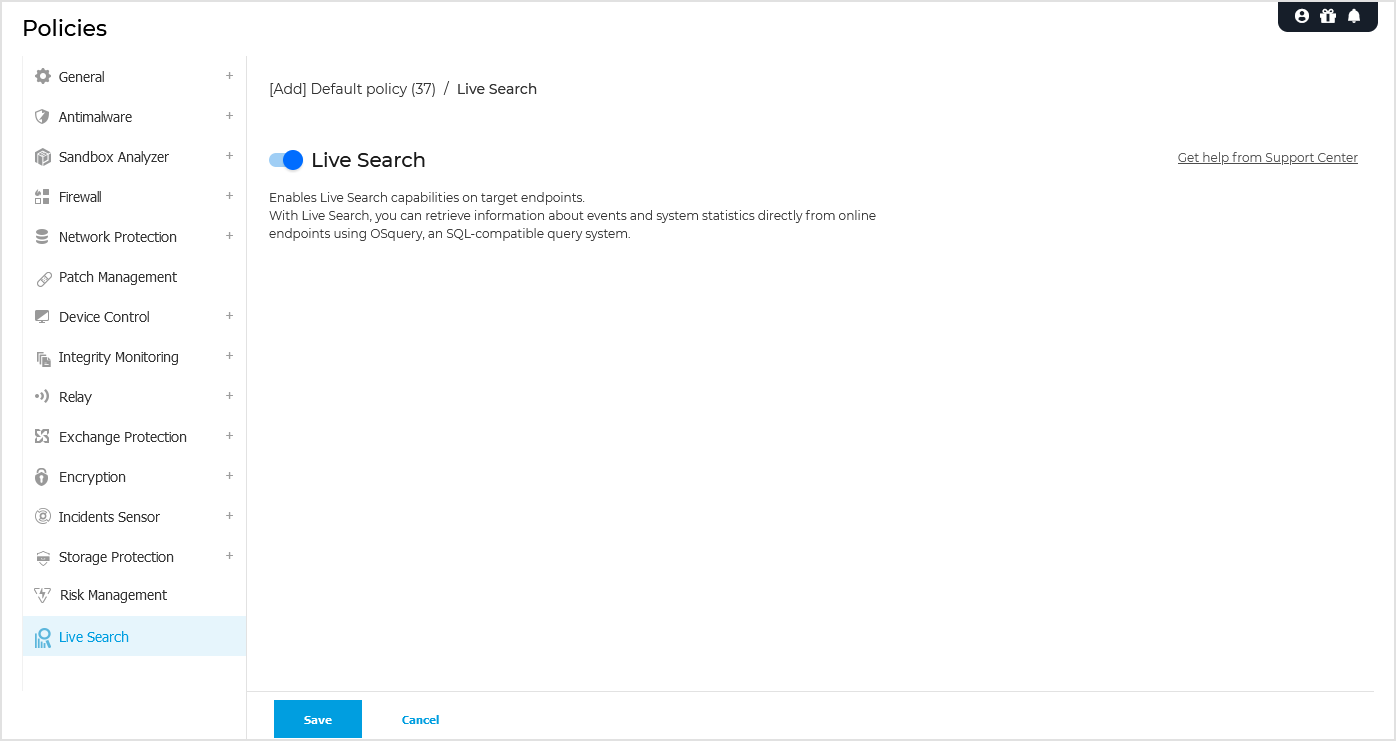
Important
Enabling this module triggers a reconfiguration of the security agent on the endpoints. This reconfiguration, in turn, initiates an agent update, bringing it to the latest available version or as configured in the policy under General > Agent > Update > Update ring.
Live Search can only be enabled via device type policies and not via rule-based policies.
The target endpoint runs a 64-bit operating system.
The target endpoint is protected by BEST, minimum version:
Windows: 7.6.1.202
Linux: 7.0.3-2085
macOS: 7.8.16.200024
You have the following permissions:
Manage Networks
Advanced Investigation
If the target endpoint is in a managed company other than your own, all the managed companies along your Network tree, from your company to the target endpoint’s company, allowed Partner assistance with security management.
If the target endpoint is in your company, you have access to your entire network.
Using Live Search
You can access the feature by going to Incidents > Search and selected the Live tab.
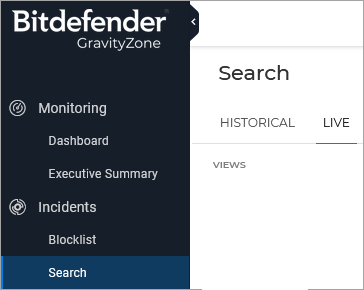
The page contains the following elements:
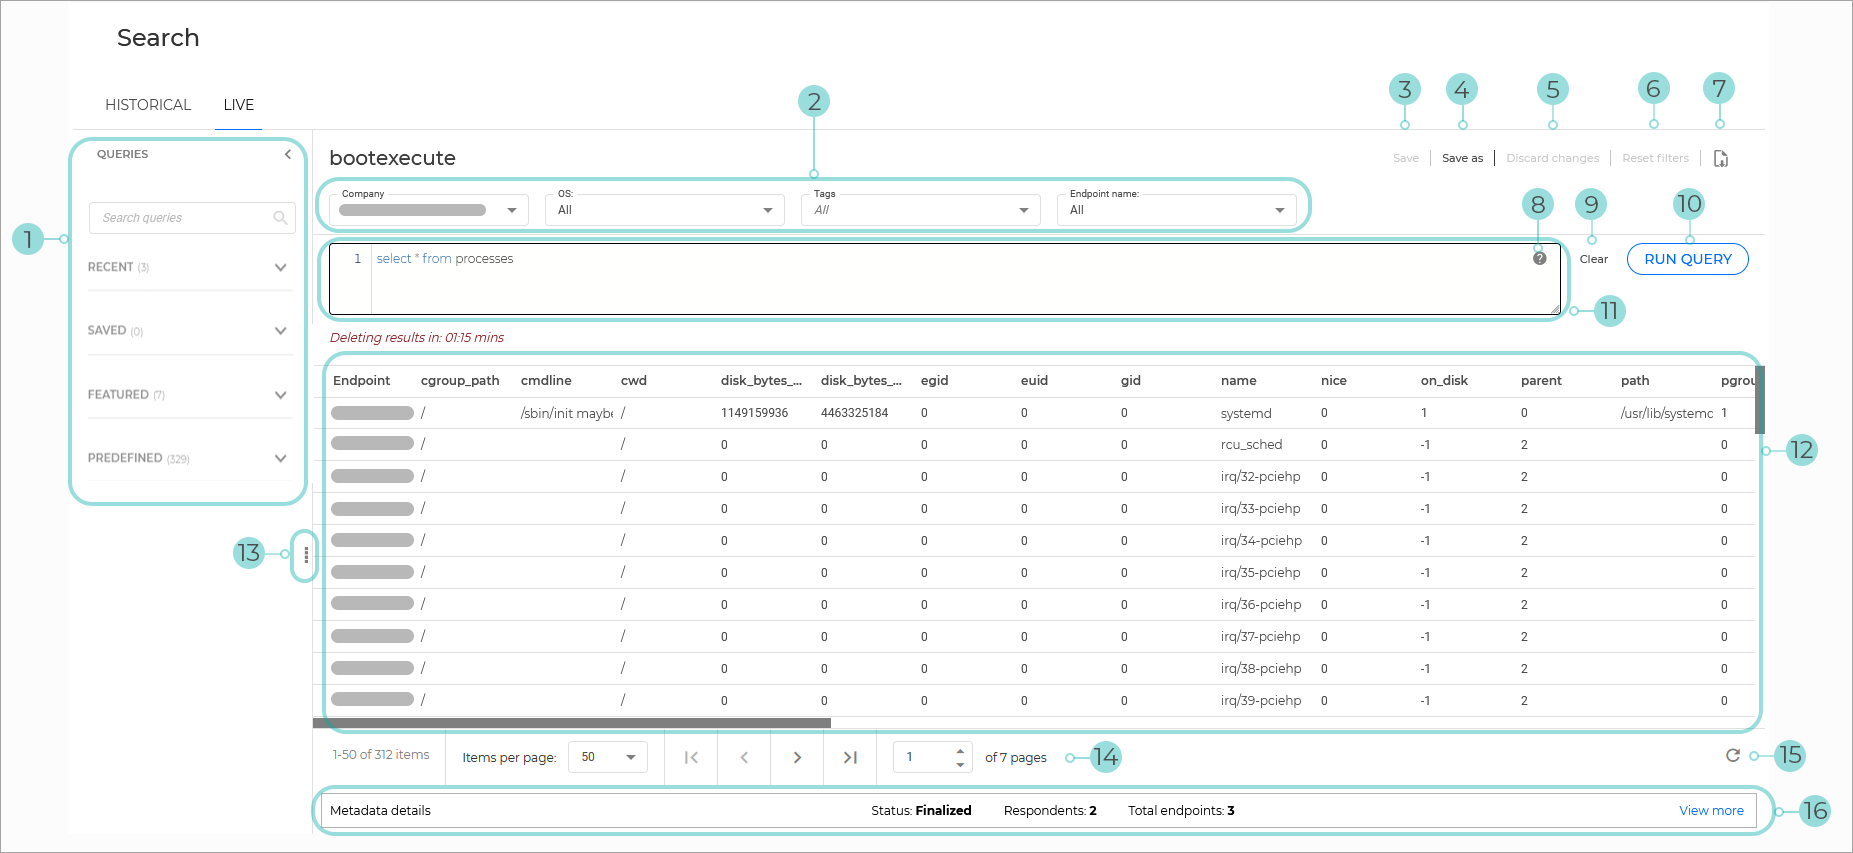
Queries panel, comprised of:
Search option - you can use this to search by title.
Recent- displays the last 25 queries that were performed.
Saved- a list of all the queries that have been saved for this user.
Predefined- a list of queries that are available by default for all customers.
Featured - a set of predefined queries selected by our security analysts.
Filters section, comprised of:
Company - perform a query on endpoints from a specific company.
OS - perform a query on specific endpoints based on their operating system.
Tags - perform a query on specific endpoints based on their GravityZone tags.
Endpoint name - perform a query on specific endpoints from a company.
Save - save changes to current query.
Save as - used when creating a new query.
Discard changes - revert the query to the last saved state. This option becomes available if the query or the filters are different from the saved state.
Reset filters - revert all changes applied to the filters. This option becomes active if one or more filter values are changed.
Download icon - used to download the query results as a .CSV file.
Info icon - displays the Tables side panel.
Clear - removes all text from the input field
Run query - run the current selected query.
Query text - write your query.
Query results - the results of the performed query.
Resize button - use this to adjust the size of the search section.
Page numbering and items displayed per page
Refresh button
Metadata details - provides additional details on the level of success of the query run. This section will always be displayed at the bottom, even if no results are present.
Create a new query
You can create a new query by using one of the methods below:
By typing in the query instructions
When first displaying the Live tab after logging in to GravityZone, a blank query will be displayed by default.
Type in the query instructions.
Select the Save button on the upper right side of the screen.
Type in a name for the new query.
Select Save.
The query is now displayed under Saved queries.
By editing an already existing query
Select the query you want to modify.
Change the instructions assigned to the query.
Select the Save as button on the upper right side of the screen.
Type in a name for the new query.
Select Save.
The query is now displayed under Saved queries.
Run a query
To run a query follow the steps below:
Locate and click the query you want to run on the left side of the screen, under Saved queries.
Select Run query.

Depending on the complexity of the query and the size of your network, it may take a few minutes to return all of the results. For the duration of the data gathering, the message In progress and a timer is displayed and the Run query button is disabled until all data is gathered.
Note
Query results will be gathered from each endpoint for a maximum of 2 minutes, after which they will be timed out and no more results will be gathered. If all endpoints respond with valid data before the the time-out, the query will be completed sooner. The Run Query button and the Metadata section will not be available while the query is running.
Results are returned depending on your query:
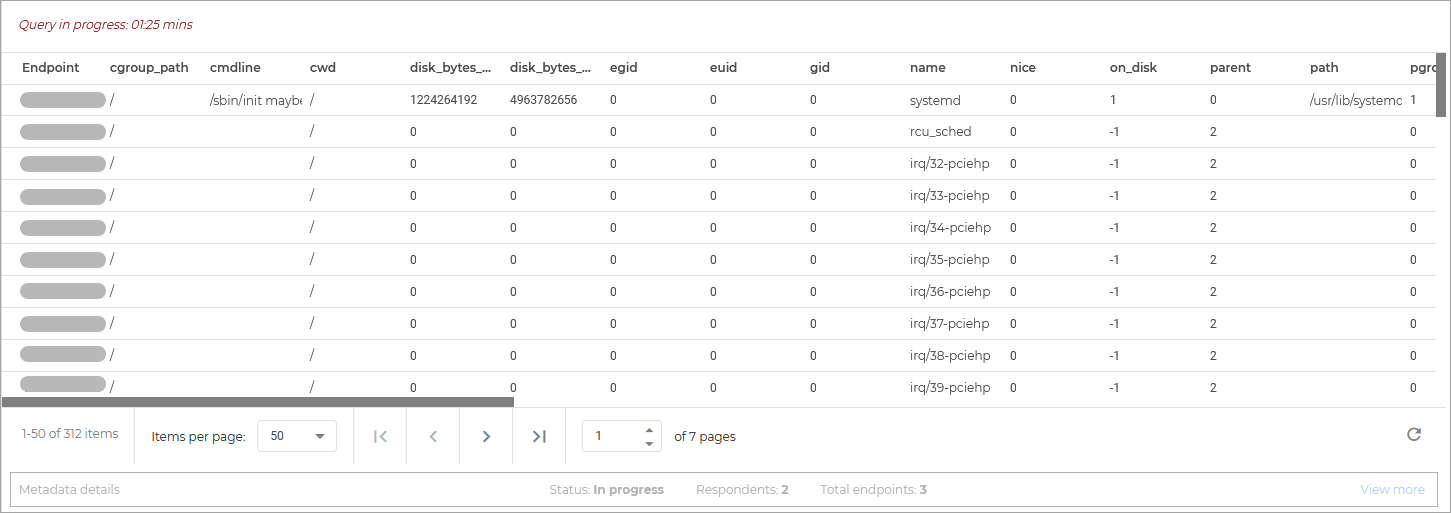
Only the first results are automatically displayed. The grid will automatically check for new results every 5 seconds until the query run completes. To manually refresh the results, you can use the Refresh button. When refreshing the results grid, the Metadata will also refresh.

The query results are available for 30 minutes. Once the time has passed, the results are deleted. A timer is available between the query instructions and the query results.
Note
You can use the  button on the upper right side of the screen to download the query results as a .CSV file.
Reading Metadata details
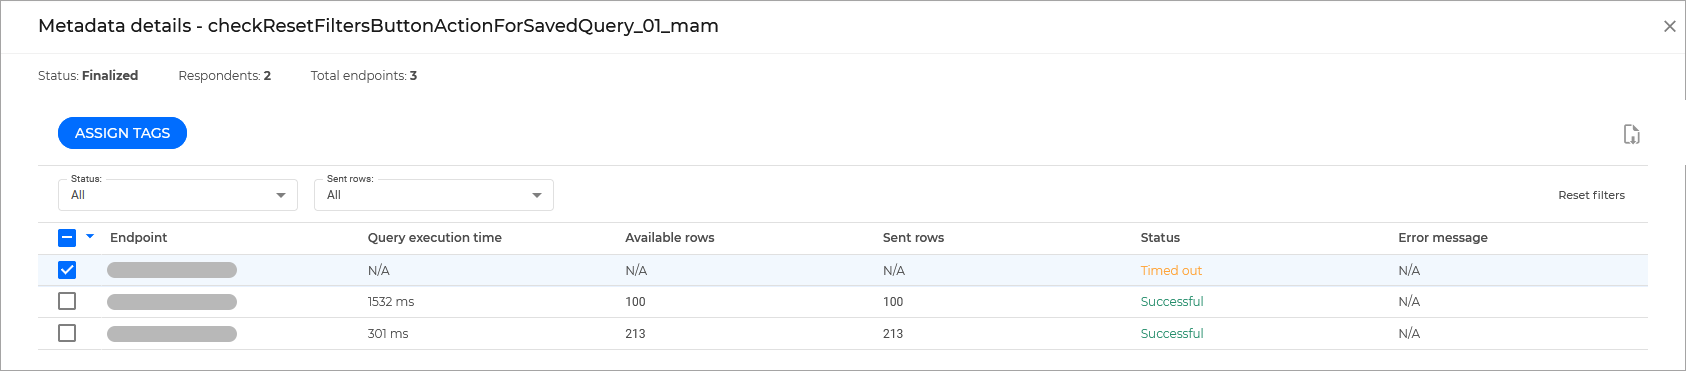
This section is collapsed by default, and contains the following data:
Status - the status of the query:
In progress - query is currently running.
Finalized - the query has been completed.
N/A - no query has been ran or the results have expired.
Respondents - the number of endpoints that have responded to the query.
Total endpoints - the number of endpoints that have been queried.
When expanded, the following information is displayed:
Query name - Metadata details is always accompanied by the query name.
Assign tags button
A filter section comprised of:
Status filter:
All
Timed out
Successful
Error
Failed to connect
Sent rows filter:
All
No results
Results available
Endpoint - the endpoint name.
Query execution time - the time the query ran on this endpoint (milliseconds).
Available rows - the total number of rows returned by the query for this endpoint.
Sent rows - the number of rows that have been included in the results.
Status - the status of the query for this specific endpoint.
Error message - the error message returned by the endpoint when queried.
Note
The information listed in the Metadata is only kept for 24 hours. You can use the
button on the upper right side of the screen to download the query results as a .CSV file.
Edit a query
To edit a query follow the steps below:
Select the query you want to modify.
Change the syntax of the query.
Select the Save button on the upper right side of the screen.
Note
Predefined queries can not be modified. Use the Save as button to create a new query.
Click Save.
The modifications to the query have been saved.
Delete a query
To delete a query follow the steps below:
Locate the query on the left side of the screen, under Saved queries.
Click the vertical ellipsis button for the query you want to remove.
Select Delete.
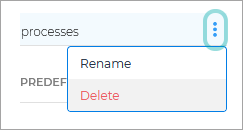
Rename a query
To rename a query follow the steps below:
Locate the query on the left side of the screen, under Saved queries.
Click the vertical ellipsis button for the query you want to rename.
Select Rename.
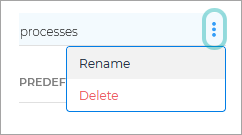
Type in the new name for the query.
Click the OK button.
Tables panel
You can inspect the database schema and search for available tables and fields using the Tables side panel.
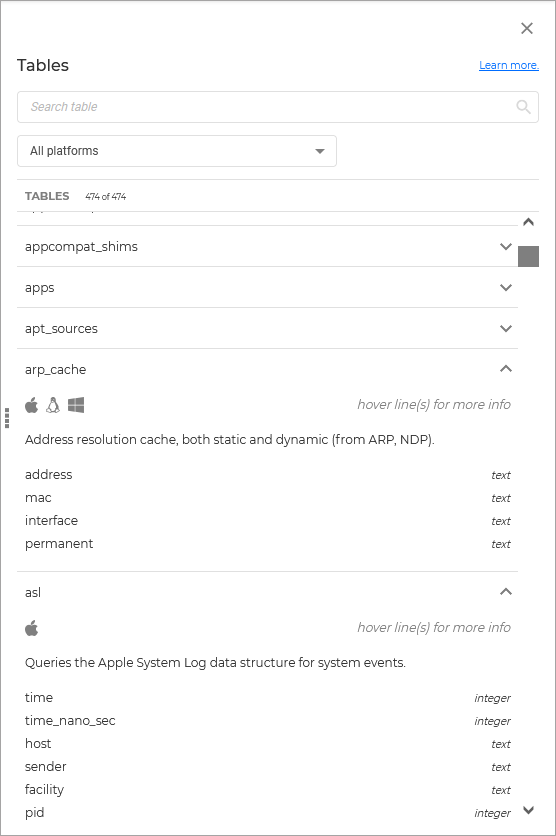
This section is accessed from the info icon located at the upper right side of the query text box.
The panel contains the following elements:
Learn more - link directs you to the available documentation.
Search field - search tables or columns using full or partial name.
All platforms filter:
All platforms
macOS
Linux
Windows
The number of items displayed.
The results found - multiple tables which can be collapsed to show the table content
Query results limitations
The following limitations apply to all query results:
Queries return a maximum of 50 000 rows per run.
Queries return a maximum of 1000 rows for each endpoint per run.
Individual endpoint row results are not redistributed to other endpoint results that have not reached their row count limit.
Live Search does not support Osquery evented tables.
Queries on individual endpoints will automatically time out after 30 seconds. This does not include the time for processing the results.
Eligibility
The feature is available to any cloud company that is licensed for GravityZone Business Security Enterprise or the A-la-carteEDR Cloud.
Submitting feedback
You can submit feedback by sending an email to xdr-eap@bitdefender.com.
The XDR query language
The query language provides the vocabulary (fields and operators) and the syntax to help you build queries.
To access information about syntax from inside the platform click the  icon inside the search bar.