Metrics
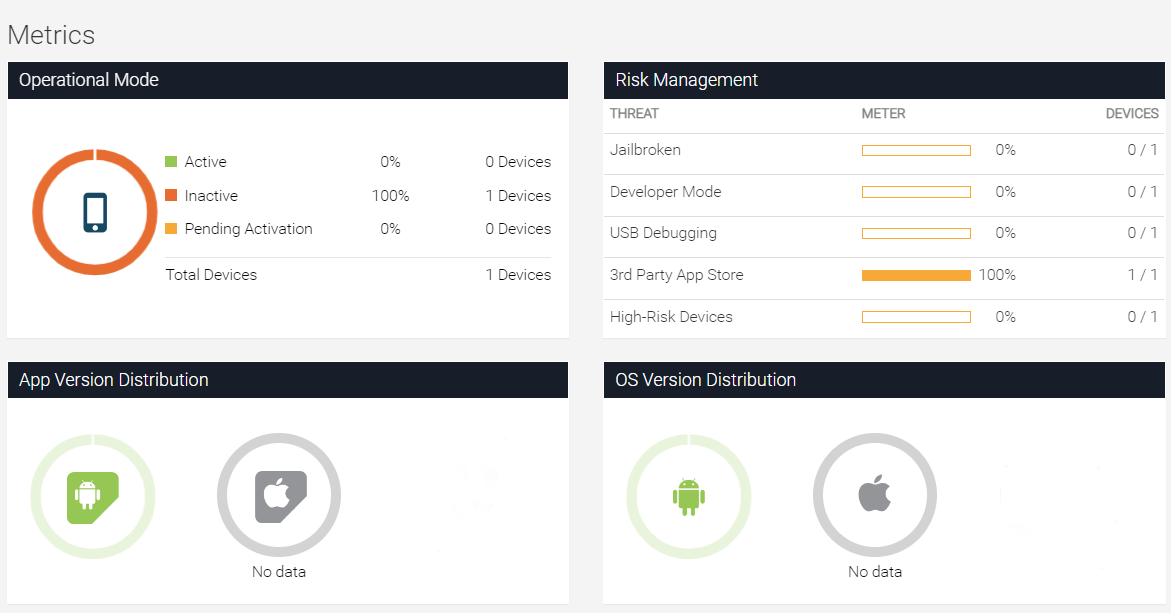
Metrics are displayed at the bottom of the Dashboard to reflect device and configuration inventory. They are not affected by date and time range selection and contain the following subsections.
The GravityZone MTD
Risk Management
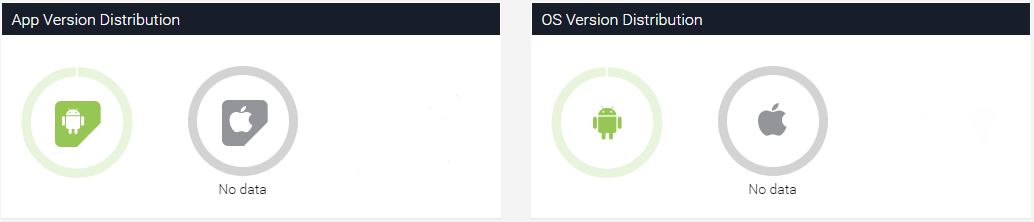
The GravityZone MTD Version Distribution
OS Version Distribution
The GravityZone MTD operational mode
The operational mode widget provides an at-a-glance view of the status of devices from a app deployment perspective without the need to access the MDM.
Mode | Description |
|---|---|
Active | Devices with the GravityZone MTD deployed and are now communicating to the Mobile Security Console. |
Inactive | Devices that are in contact with the Mobile Security console as per the Device Inactivity Configuration setting in the Manage page. |
Pending Activation | When a device is first synchronized, it is marked in an ‘Active state. If it is not activated prior to the inactivity period defined, it is then marked as Pending Activation. |
Risk Management
The risk management widget shows the risk status of devices within the organization.
Risk | Description |
|---|---|
Jailbroken | The number of devices that GravityZone MTD detected as either Jailbroken/Rooted or in the process of being Jailbroken/Rooted. |
Developer Mode | The number of devices that the GravityZone MTD detected with USB Debugging enabled. |
3rd Party App Store | The number of devices that GravityZone MTD detected with the Unknown Sources configuration |
High-Risk Devices | The number of devices that GravityZone MTD detected with the Stagefright vulnerability |
Mobile app version distribution and OS version distribution
These sections display the distribution of app versions inside the organization and the distribution of mobile operating systems in the organization (Android, iOS, and Windows).
Hover over the graph to see the number of devices and OS versions.