Control Center at a glance
This section serves as orientation through the GravityZone Control Center console and provides a quick description of all first level pages available in GravityZone. The pages are presented in the order that they appear in the console, from top to bottom.
Main pages
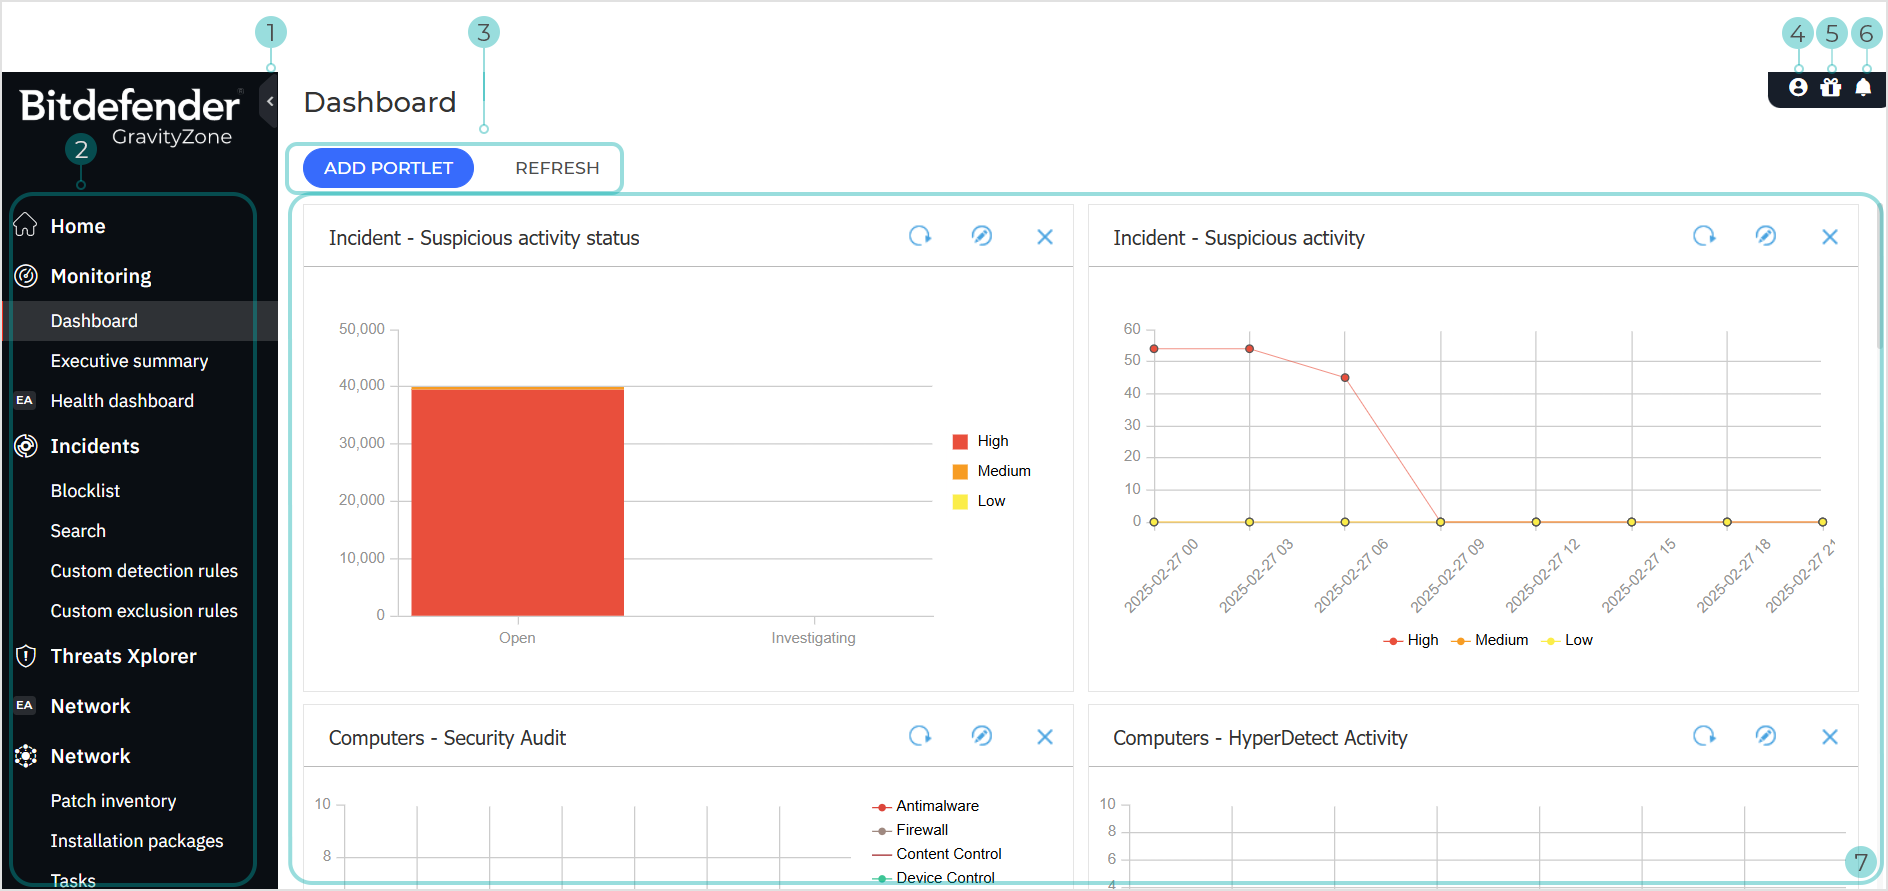
Toggle menu view
Use the View Menu button to view, hide, or expand the menu options. Click the button to run though the options sequentially, or double-click to skip.
Main menu options
The menu contains links to all the main Control Center pages.
Pagination toolbar
Depending on the page that is displayed, the Page Toolbar contains buttons or drop-down menus that allow you to interact directly with the information being displayed on the page.
User menu
The User menu provides several account and company management options:
My account. Click this option to manage your user account details and preferences.
My company. Click this option to manage your company account details and preferences.
Integrations. Click this option to manage GravityZone integration with other management platforms.
Credentials manager. Click this option to add and manage the authentication credentials required for remote installation tasks.
Help and support. Click this option to find help and support information.
Feedback. Click this option to display a form allowing you to edit and send your feedback messages regarding your experience with GravityZone.
Theme. You can customize your GravityZone Control Center theme by choosing from: System theme (default), Light theme, Dark theme, or High contrast theme.
Logout. Click this option to log out of your account.
What's new
For important Control Center updates, we add a short description of changes and additions in the What's New section. For all updates, we also include in the section a link to the more detailed Release Notes.
Notifications
Notifications provide easy access to notification messages and also to the Notifications page.
Page content
Displays and allows you to interact with information relevant to the page that is currently selected.
Control Center pages
Home
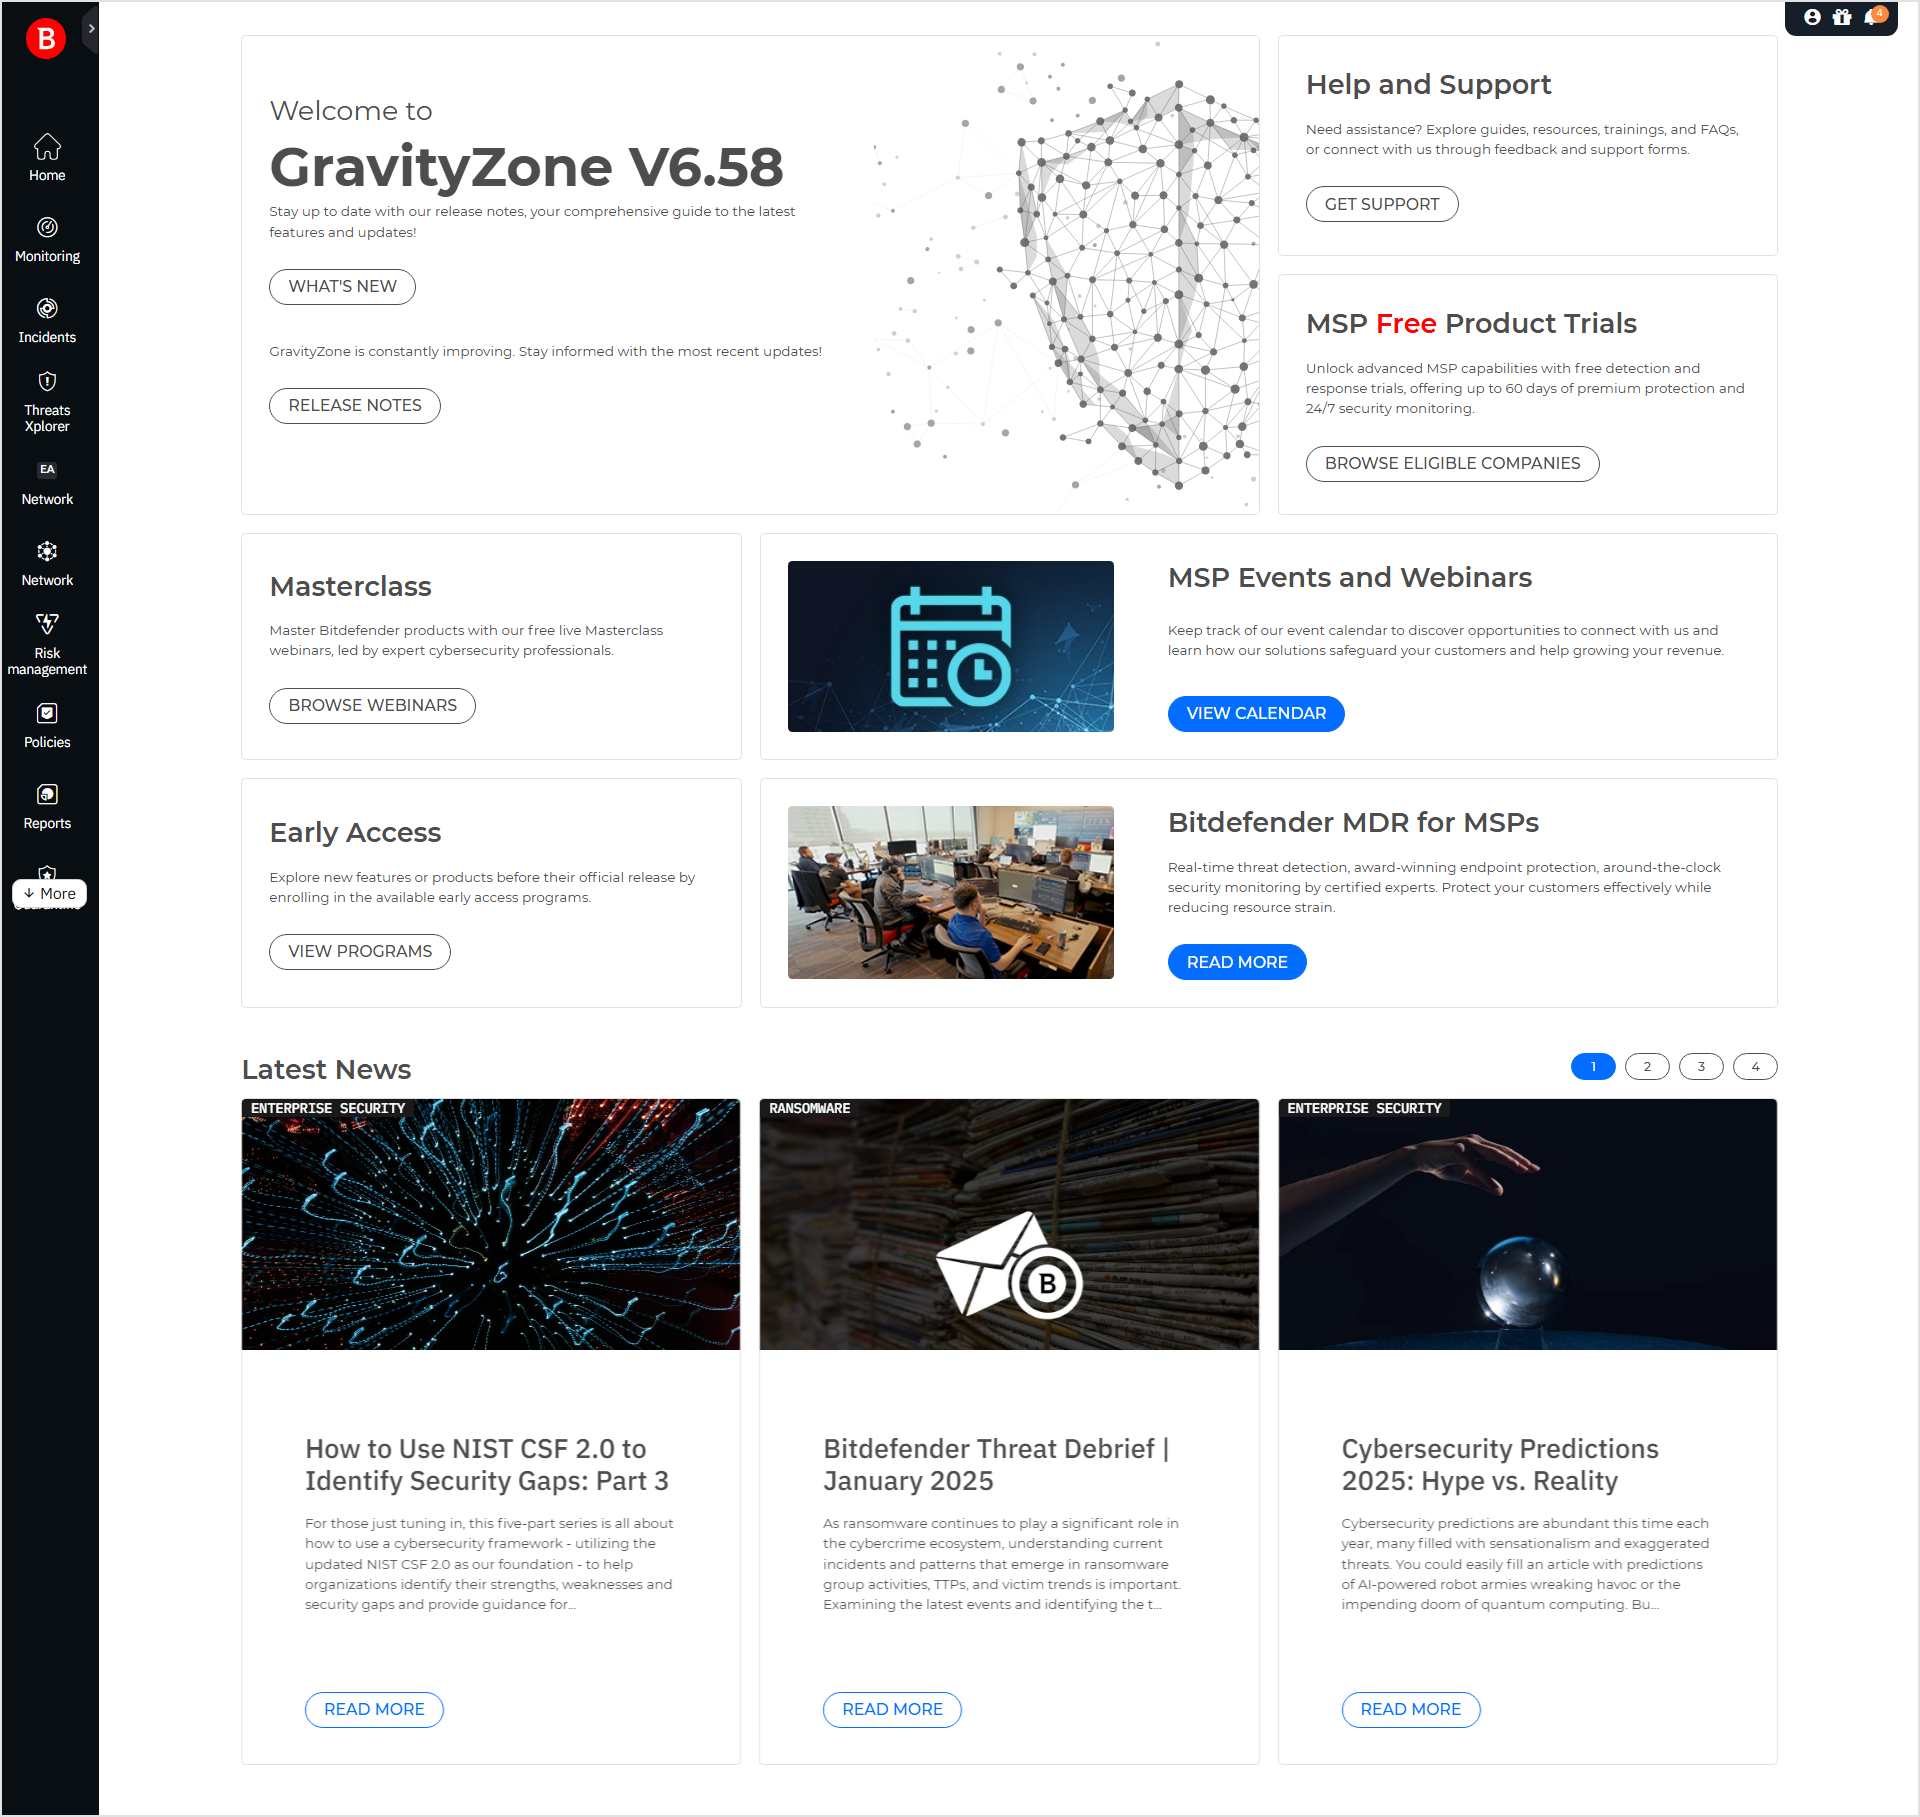
Partner type companies with a monthly subscription can view a Control Center home page that presents a high-level overview of the GravityZone capabilities. By employing a series of widgets, the page displays user-friendly content that simplifies basic tasks and provides access to the latest news.
Monitoring
Dashboard
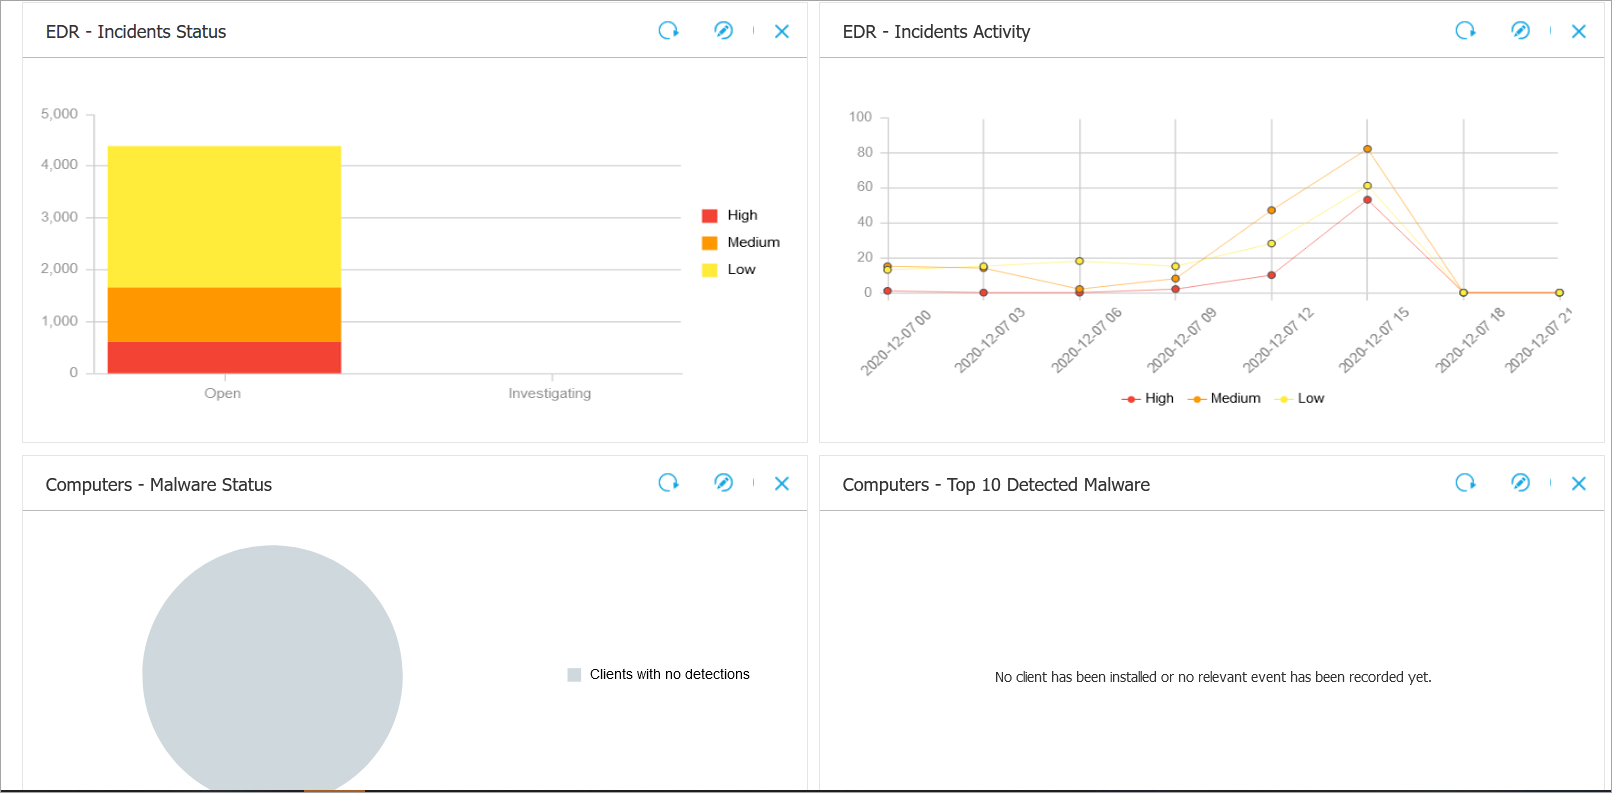
The Dashboard consists of a series of portlets that provide you with security event information from your environment. You can customize the portlets and create your own, specifying the protection mechanism you would like the monitor and the time interval you would like to see in the data.
Portlets are interactive; if you wish to display further information on any event you can click on the datapoint in the portlet representing said event. Doing so will display a report that is representative of the time interval in which the event occurred and provides more in-depth information.
Executive Summary
The Executive Summary page presents a high-level, endpoint-focused version of the Dashboard, providing a series of widgets displaying details about endpoint modules, detections and taken actions, threat types and techniques, your company risk score, threat breakdowns, statistics, and many more.
Note
As opposed to Dashboard portlets, the widgets in the Executive Summary screen are static and read-only.
Incidents
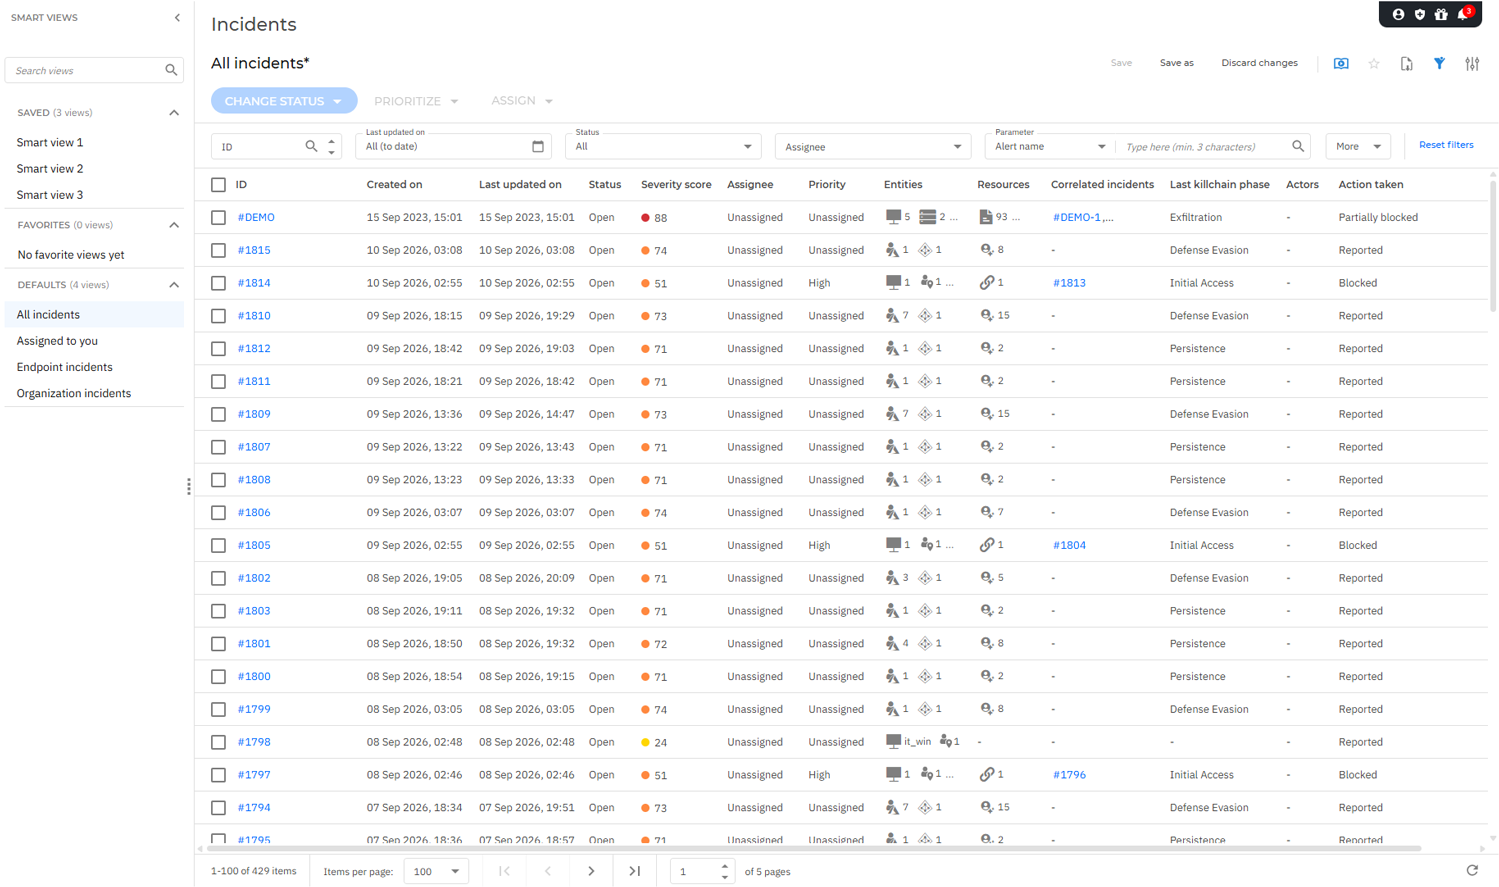
The Incidents page helps you identify, investigate, and manage potential threats detected across your environment. It provides powerful filtering, investigation, and response capabilities for incidents retained for up to 90 days by default, with the option to extend incident data retention to 365 days by purchasing the EDR Data Retention add-on.
Clicking an incident displays additional information about the event.
GravityZone groups security activity into two incident types, helping you investigate threats at both endpoint and organizational level:
Organization incidents aggregate related activity detected across multiple entities and data sources. The visibility and correlation capabilities available for these incidents depend on the sensors deployed and configured in Configuration > Sensor Management. Deploying additional sensors can provide broader coverage and richer investigation context.
Note
Available with the following licenses: GravityZone Business Security Enterprise, GravityZone EDR Cloud, GravityZone Defense XDR.
Endpoint incidents are generated by activity detected on managed endpoints. These incidents can originate from prevention technologies such as Antimalware, Advanced Threat Control, Network Attack Defense, and other protection modules, as well as from the EDR module.
Note
Available with the following licenses: GravityZone Business Security Premium, GravityZone Business Security Enterprise, GravityZone EDR Cloud, GravityZone Defense XDR.
For complete details, refer to the full documentation: Investigating Incidents.
Blocklist
The Blocklist page allows you to manage files, applications, and network connections identified as potential threats during incident investigations. By creating and deploying blocklist rules across managed companies, you can prevent malicious or unwanted content from running on endpoints or communicating over the network.
Use this page to create hash-based, path-based, and connection-based blocking rules, helping security teams contain threats, reduce attack surface, and prevent recurring incidents. The page also provides centralized visibility into existing blocklist rules and their configuration details, making it easier to maintain protection across your environment.
For more information, refer to Blocklist.
Search
Detailed information is available in the full documentation: Searching security events.
Historical
The Search > Historical tab allows you to investigate previously collected security events and alerts stored in the security events database. Using advanced search capabilities and filters, you can analyze endpoint and XDR telemetry, perform threat hunting activities, and identify indicators of compromise across your environment.
Live
The Search > Live tab enables you to run real-time queries on managed endpoints and retrieve up-to-date information directly from devices. It helps security analysts quickly investigate suspicious activity, collect forensic data, and validate findings by accessing the current state of endpoints during an active investigation.
Custom rules
The Custom detection rules and Custom exclusion rules sections allow you to create and manage custom rules that tailor incident generation to your organization's requirements. Custom rules apply only to EDR and XDR detections and do not affect prevention technologies such as Antimalware, Advanced Threat Control, or Network Attack Defense.
These sections include the following rule types:
Custom exclusion rules: They define behavior patterns that should be excluded from incident generation. Events matching these rules do not generate incidents, but remain available in Historical search for further investigation if needed.
Custom detection rules: They define behavior patterns that generate alerts and incidents when matched, helping you identify activity that is relevant to your environment and investigation requirements. Detection rules can be created using either standard rule-based criteria or YARA queries.
To learn more, refer to:
Threats Xplorer
Threats Xplorer is specially designed to offer you highly increased visibility over the detected threats in your network. The feature centralizes detection events from multiple GravityZone technologies and classifies them by category, threat type, remediation actions, and many others. You can easily identify and analyze any event from your company over a specific time interval by using the available filters. You can select filters from the drop-down menu or type keywords that match your desired results.
Network

In the Network page you can display, search for, and manage your companies, networks and endpoints. For each entity you can perform various operations such as display additional information, create tasks and reports, assign policies, troubleshoot and more.
Patch Inventory
The Patch Inventory page displays all patches discovered for the software installed on your Windows and Linux endpoints and provides several actions you can take on these patches.
Installations Packages
The Installation Packages page allows you to manage, create, download and send agent installation kits.
You can customize an installation package to specify the language, modules, roles, scan mode and method of installation.
Tasks
The tasks page displays a list of all the tasks that were initiated inside your managed companies. Each task provides additional information. You can narrow down the list of displayed tasks by using several filters.
Tags Management
The Tags Management page displays the list of all endpoint tags available in the Network. Tags are pieces of information that help you easily identify and take actions on managed endpoints, such as assigning policies based on specific rules or filtering items in the Network page.
Risk Management
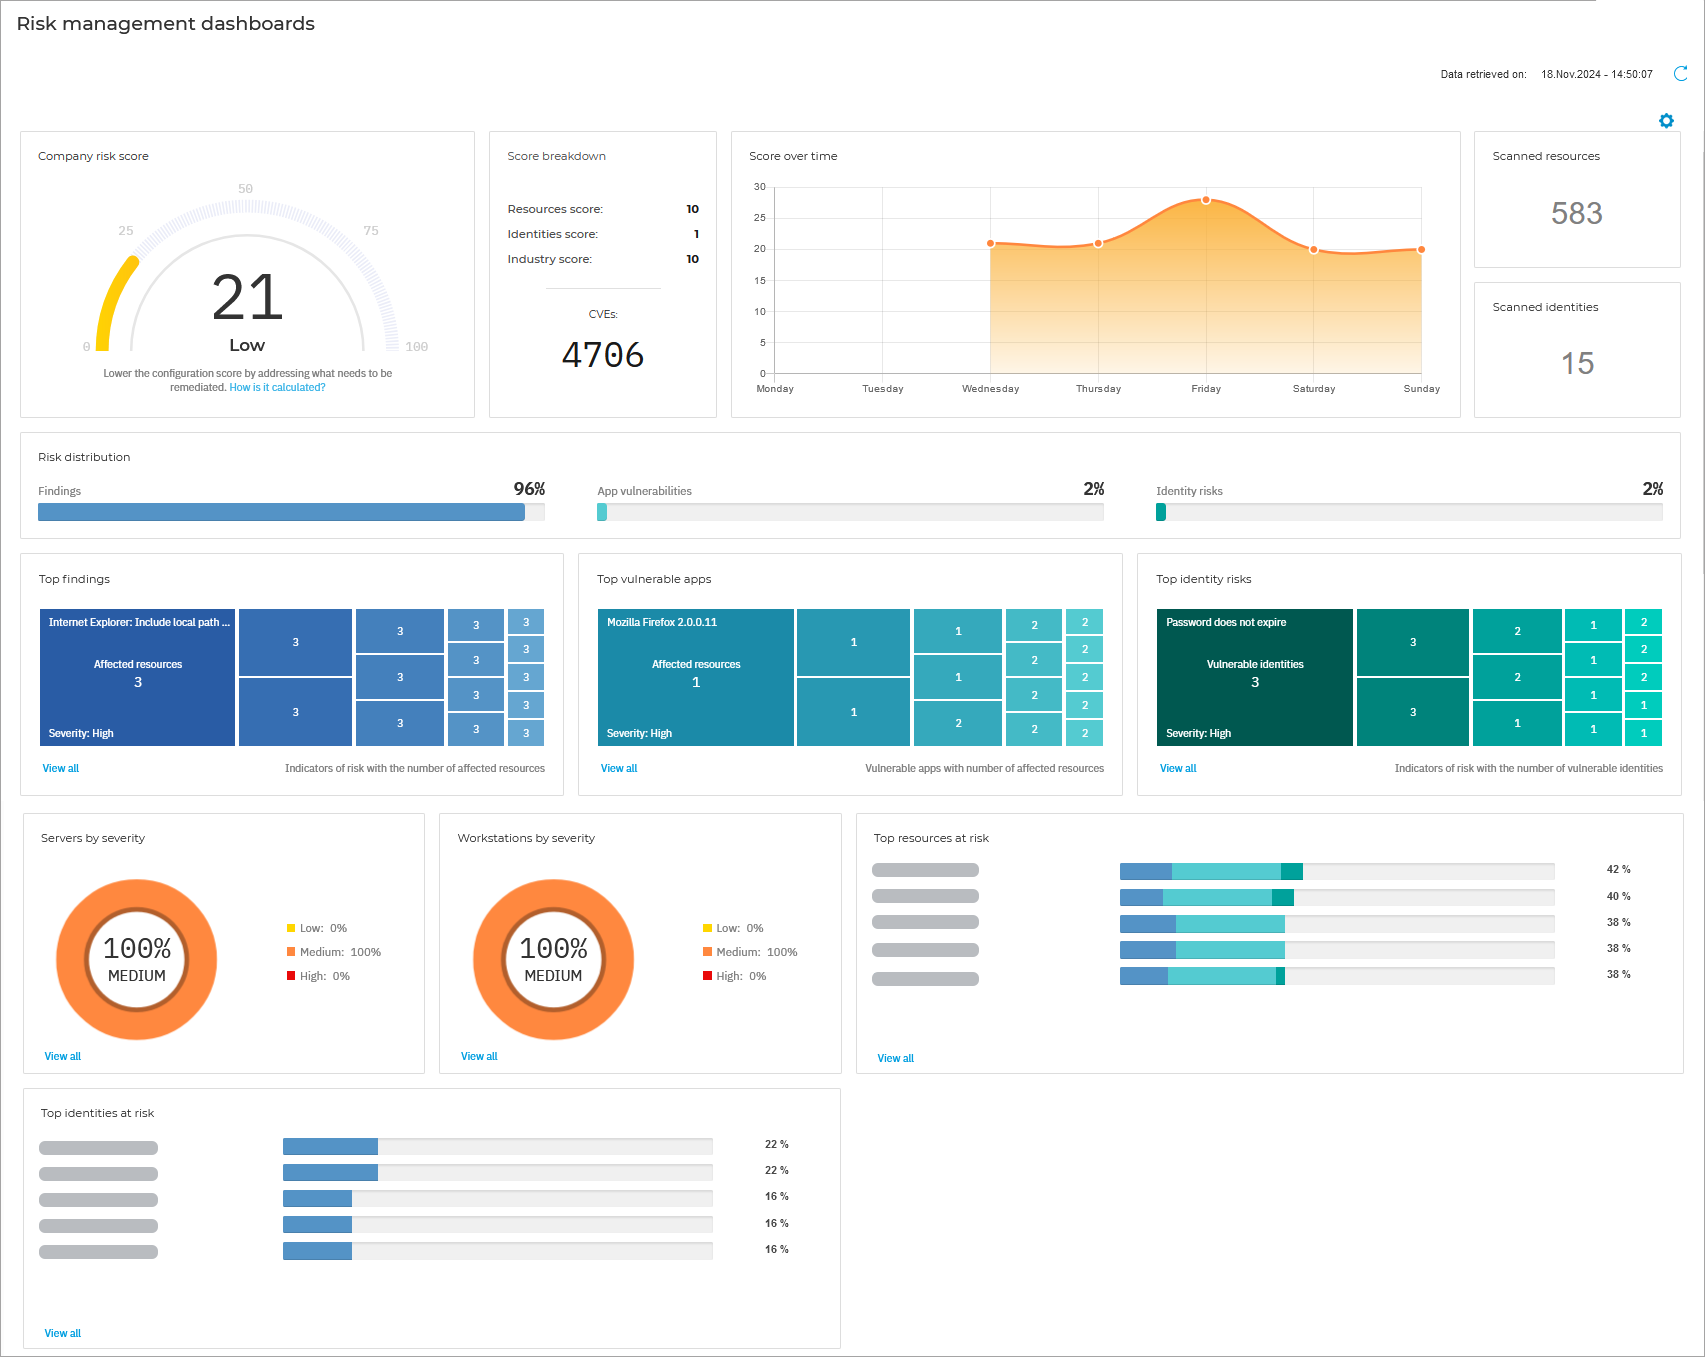
The Risk Management page provides you with a network and operating system risk overview and with the capability of creating and managing scan tasks. You can set the tasks to run recurrently on specific endpoints and choose from a large number of indicators of risk to search for to locate any vulnerabilities.
Security Risks
The Security Risks page displays the results of the scan tasks created in the Risk Management page. The results contain information on possible risks, affected devices and vulnerable users in a fully customizable table formation with complex filtering options.
Companies View
As a partner, in the Companies View page you can display a high level overview of risk management applied over all your companies. You can view each company's risk score, search or filter out results and export lists as .csv files.
Policies

In the Policies page you can create, customize and assign your company's security policies.
A policy specifies the security settings to be applied on target network inventory objects (computers, virtual machines or mobile devices). You can create as many policies as you need based on security requirements, for each type of managed network object.
Configuration Profiles
In the Configuration Profiles page, you can create and manage collections of settings outside policies so that you apply them in your network in an efficient manner.
Assignment rules
In the Assignment Rules page you can define user and location-aware policies. For example, you can apply more restrictive firewall rules when users connect to the internet from outside the company or you can enable Web Access Control for users that are not part of the administrators group.
Integrity Monitoring Rules
In the Integrity Monitoring Rules page you can set up rules that allows the Integrity Monitoring feature to take action when events are generated for files, folders, registry entries, users, services and installed software.
Reports

The Reports page allows you to create and view the results of multiple types of reports reports on the security status of your managed network objects. Reports can consolidate data from the entire network of managed network objects or from specific groups only can be used for multiple purposes.
Several different report types are available so that you can easily get the information you need. The information is presented as easy-to-read interactive charts and tables, allowing you to quickly check the network security status and identify security issues.
Ransomware Activity
The Ransomware Activity page provides information on the ransomware attacks that GravityZone has detected on the endpoints you manage, and provides you with the necessary tools to recover the files affected during the attacks.
Integrity Monitoring Events
The Integrity Monitoring Events page contains all the detected events which have been triggered by on default and/or custom rules.
Quarantine
Computers and Virtual Machines
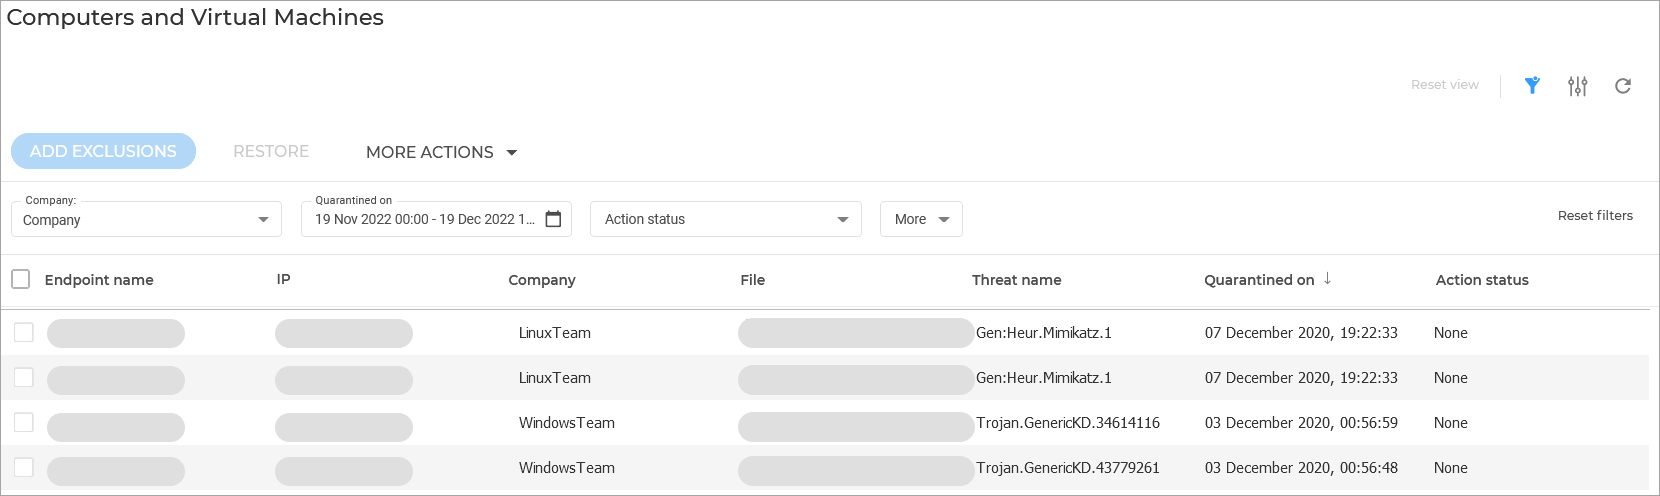
The Quarantine page provides on overview on all malicious files, such as malware-suspected, malware-infected or other unwanted files that have been detected by GravityZone protection. You can search or filter through the list of files, display additional information on each of them and decides on whether to restore, download or delete the files.
When a virus or other form of malware is in quarantine, it cannot do any harm because it cannot be executed or read. GravityZone moves files to quarantine according to the policies assigned to endpoints.
Exchange Servers
The Exchange quarantine contains emails and attachments. The Antimalware module quarantines email attachments, whereas Antispam, Content and Attachment Filtering quarantine the whole email.
Companies
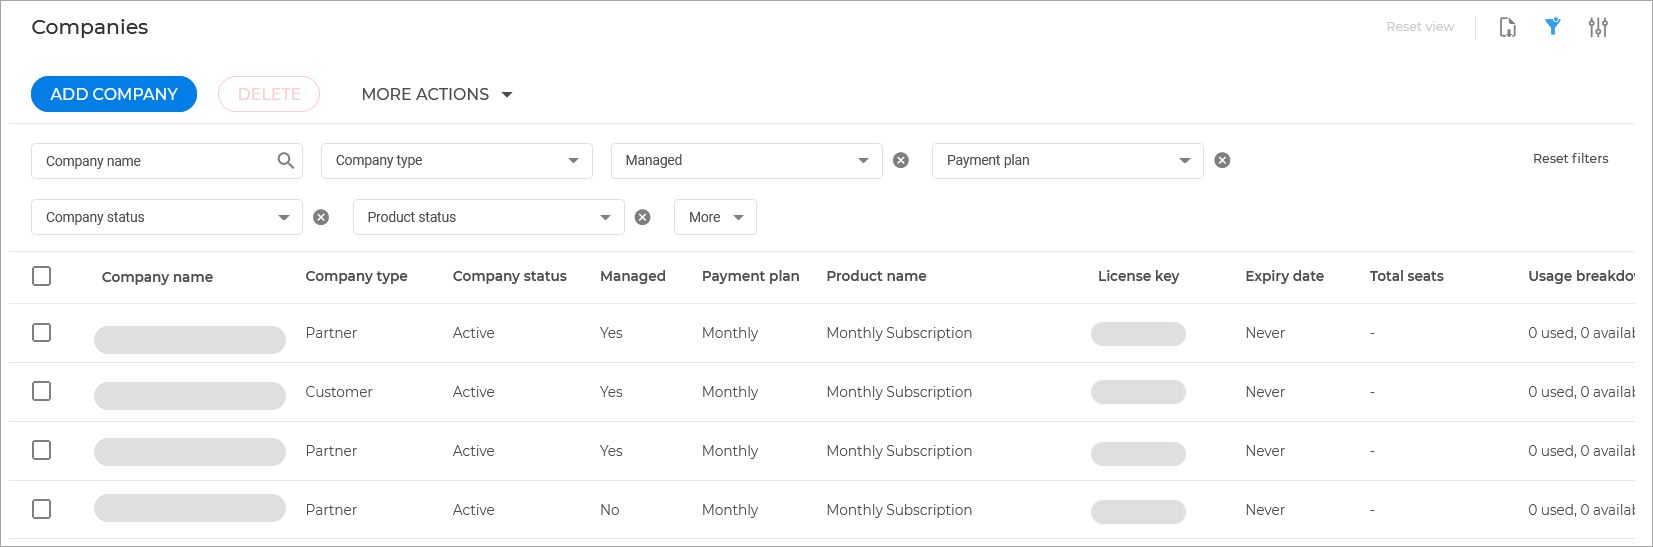
The Company page provides you with a list of all managed companies and allows you to create additional companies or manage already existing ones. You can modify company information, login security settings, license usage and assigned protection modules.
Custom Fields
In the Custom Fields page you can manage, import and export custom fields used to store third party or other custom data and facilitating billing automation.
Accounts

In the Accounts page you can create and manage all your company user accounts. For each user you can add personal information, modify login security settings and assign a default language, timezone and user role.
User Activity
You can use the User Activity page to search for any actions taken by a specific user on a specific company and logged by Control Center.
Sandbox Analyzer
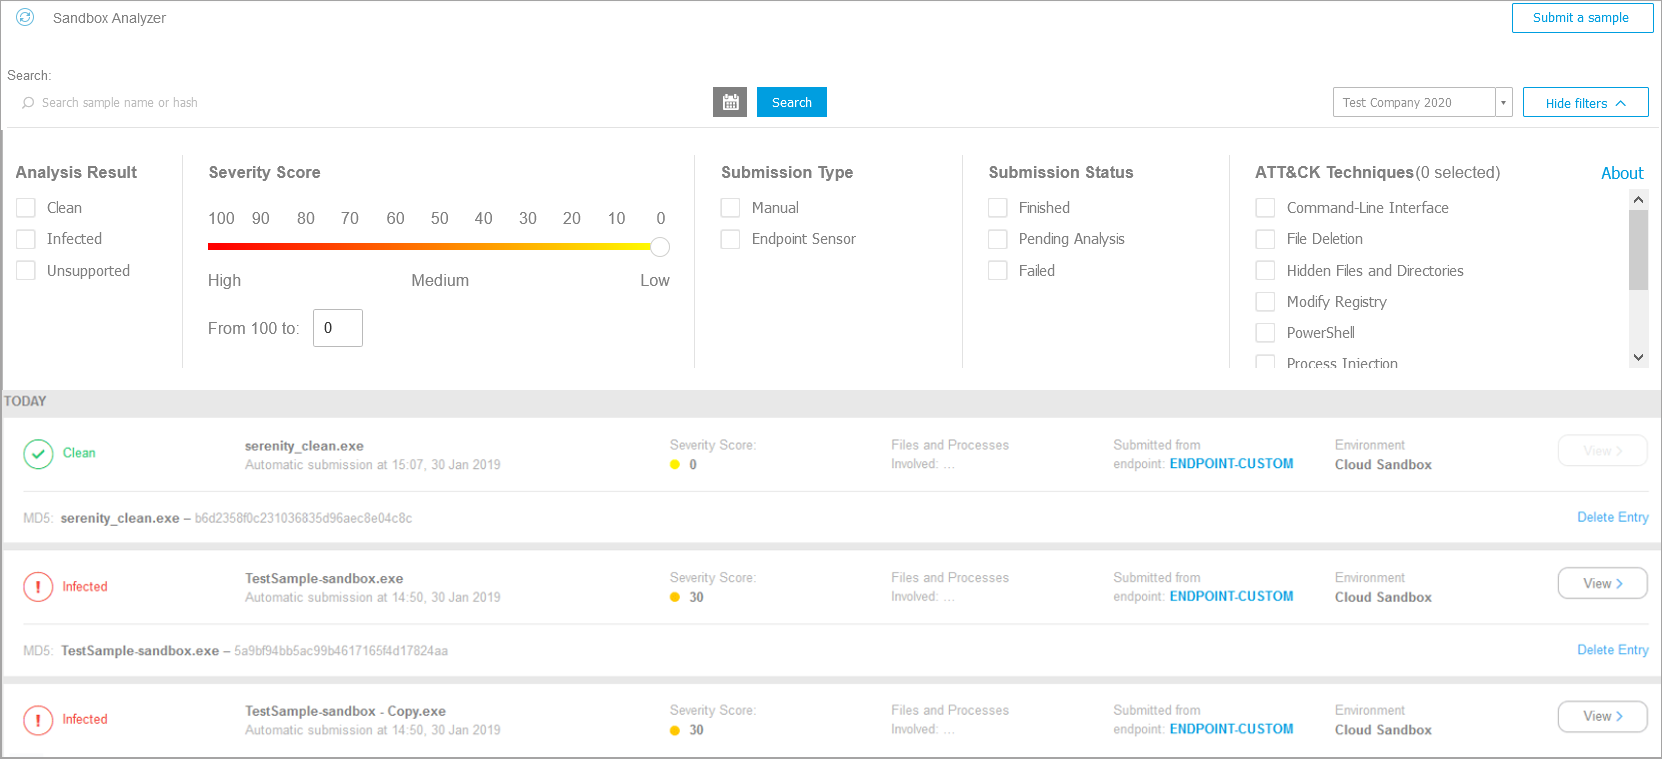
In the Sandbox Analyzer page you can configure the Sandbox Analyzer settings for automatic submission via Bitdefender Endpoint Security Tools.
Sandbox Analyzer provides a powerful layer of analysis by performing automatic detonation of suspicious content in a secure cloud environment, for files not yet signed by Bitdefender antimalware engines.
Manual Submission
In the Manual Submission page you can send samples of suspicious objects to Sandbox Analyzer, to determine whether they are threats or harmless files.
Email Security
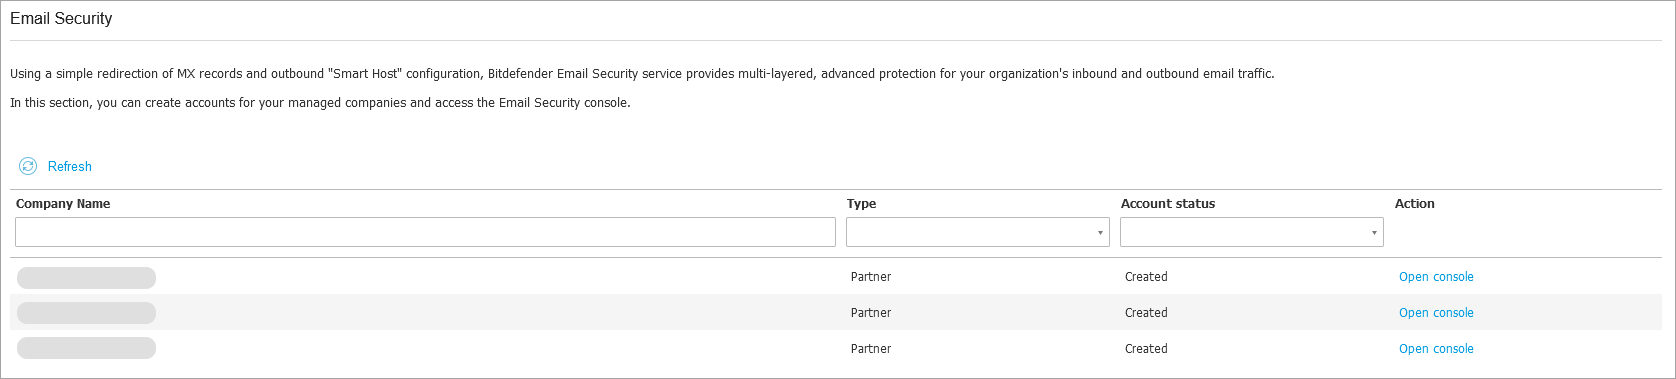
In the Email Security page you can access the Email Security console and create accounts for your managed companies.
Bitdefender GravityZone Email Security is a cloud-driven email security gateway able to protect any type of email service against various types of email-centric threat vectors.
Mobile Security
In the Mobile Security page you can access the Mobile Securityconsole and create accounts.
Mobile Security is a cloud-only mobile security solution able to protect mobile devices with Android or iOS operating systems against multiple threat vectors.
Configuration
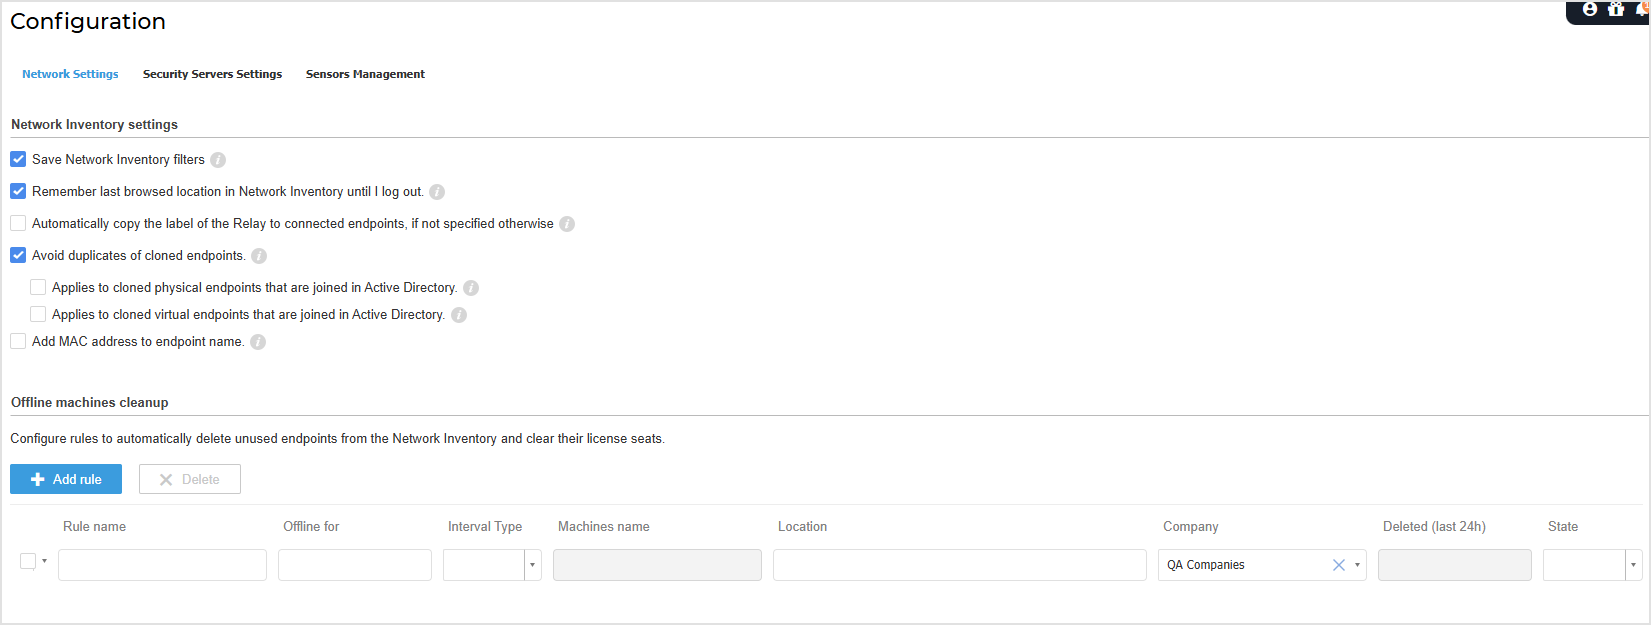
In the Configuration page, you can configure settings related to Network Settings, Security Servers Settings, and Sensors Management.