The Risk Management dashboard
The Risk Management dashboard provides an overview of your network security and risk assessment formation.
You can access this dashboard by selecting Risk Management from the default views of the ASM Dashboard.
Each widget can be individually configured. Hovering over a widget displays the buttons that enable you to customize it:
Move - you can move any widget to a new position by using
 .
.Resize - you can resize any widget by using
 .
.Close - you can close any widget by using
 .
.
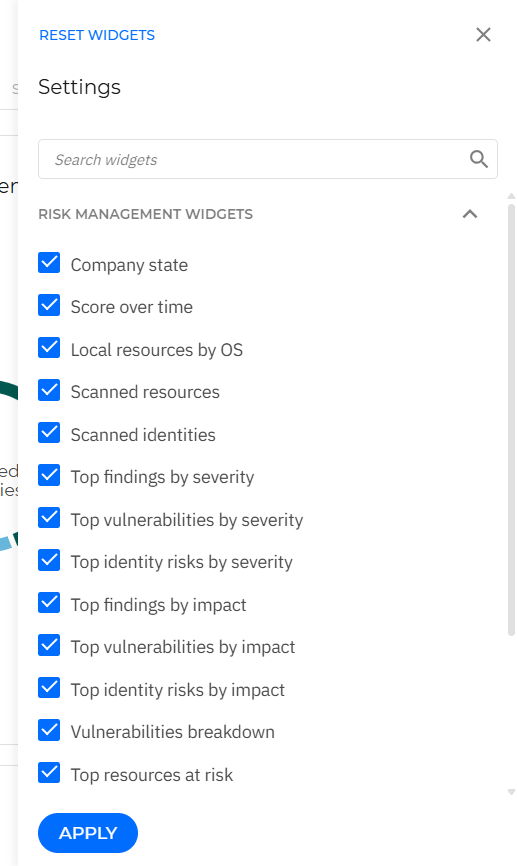
Selecting  from the upper right area of the dashboard displays a list of all the available widgets. You can quickly choose which of these should be displayed by selecting or clearing their respective check boxes.
After editing a view, you can also save it as a custom view that can be readily accessed from Smart Views. To do so, simply select Save as from the upper right section of the ASM Dashboard.
The data displayed on this page is organized in several widgets:
Company state
The Company state widget shows your organization’s overall risk score, illustrated by the outer arc. It also displays individual scores for resources, accounts, and modifiers, each represented on the inner arc.
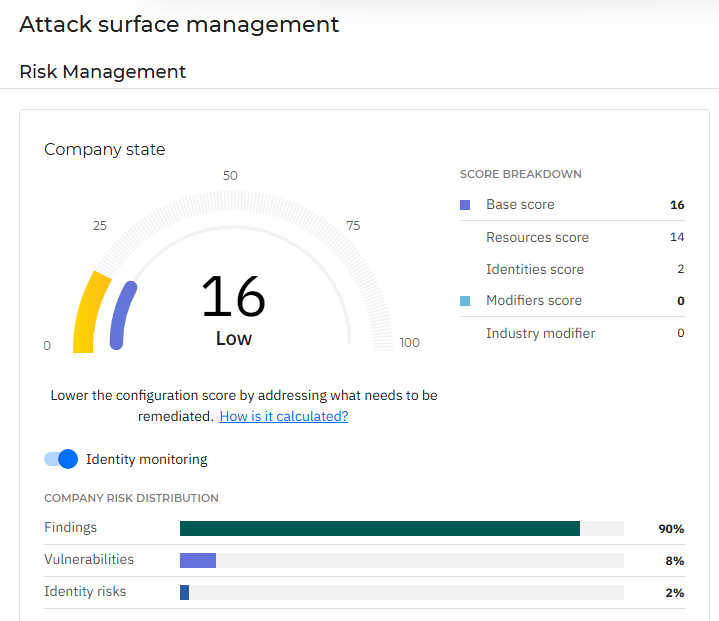
By default, Identity monitoring is disabled, but you can enable it using the switch on the Company state widget.
Note
If Identity monitoring is disabled, the widgets related to accounts and account risks no longer display data.
Your total company risk score is calculated based on the resource, identity, and industry risk scores.
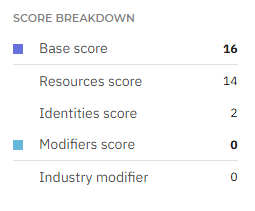
The Score breakdown section shows how your company’s overall risk score is built. It combines two parts:
A base score that reflects the level of risk associated with resources and accounts found in your environment.
A modifiers score associated with the number of unresolved CVEs found in your environment that are already actively exploited in your industry.
Note
Running an on-demand Risk scan on a new target endpoint will influence the overall score. The results are kept for 90 days, or until the next scan.
Note
For accurate information, make sure the industry assigned to the company in the My Company page is accurate.
Important
For more details about user data processing, refer to Identity risk data collection.
The Company risk distribution section provides a breakdown of the existing risks in your company, grouped per type:
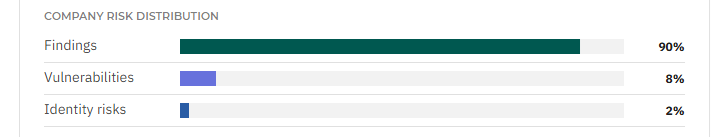
For more information on each risk type, you can access the following links:
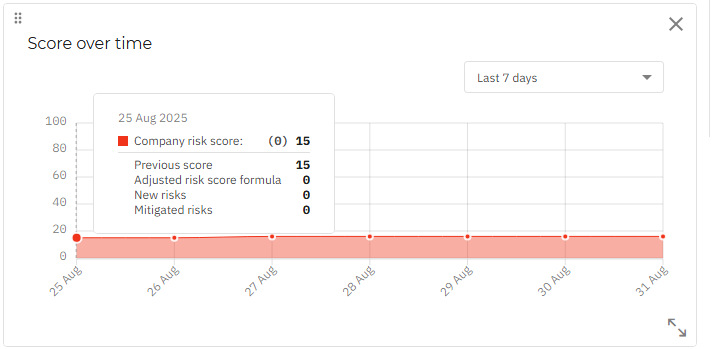
Score over time
This widget is a histogram that displays the weekly evolution of your company risk score from the last seven days, until 12 AM of the current day.
Note
Please note that the time configured in your GravityZone account is used for this measurement.
You can configure the date range you want to view from the drop-down menu in the top left part of the widget.
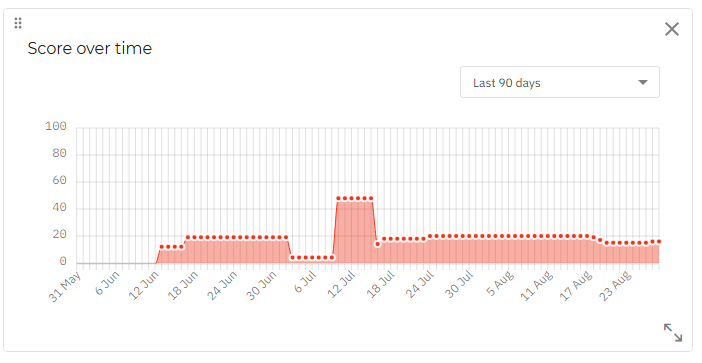
You can also view more details on the score evolution for each point in the chart by hovering over it.
Scanned resources
This widget informs you of the number of scanned and monitored resources, along with a breakdown by resource type.
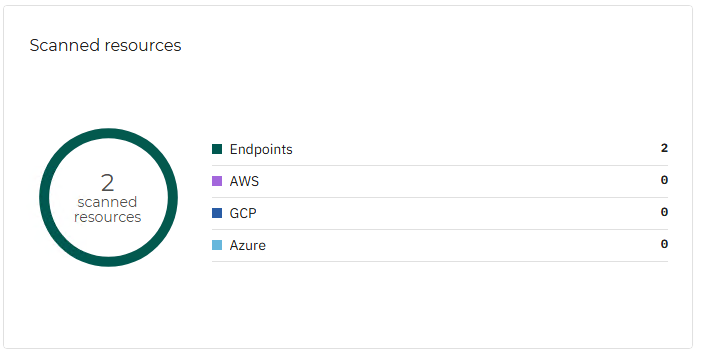
If you click an individual finding in this widget, it is opened in the Resources page, in a new tab, where you may take appropriate actions to mitigate this risk.
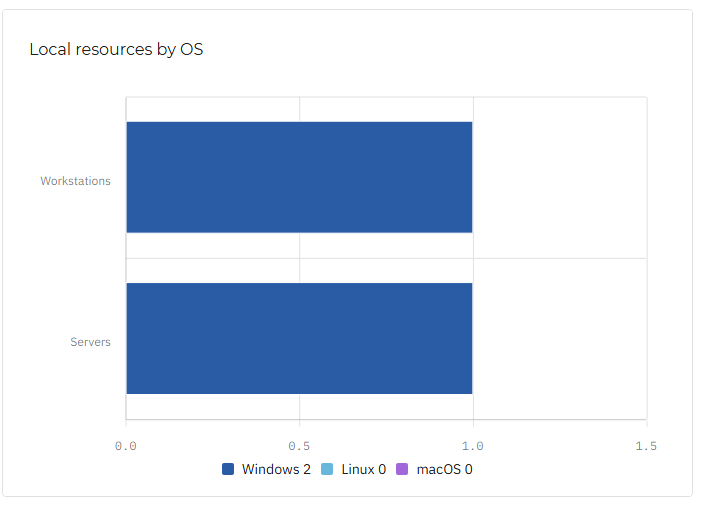
Local resources by OS
This widget displays the servers and workstations in your infrastructure, sorted by the operating system they use (Linux, MacOS or Windows.)
Scanned accounts
Similar to Scanned resources, this widget uses a donut chart to show the number of scanned accounts, along with a breakdown by identity type.
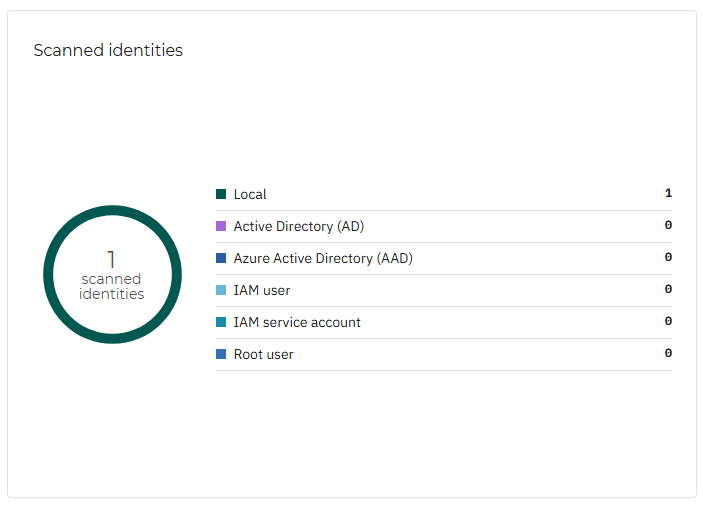
If you click an individual finding in this widget, it is opened in the Account risks page, in a new tab, where you may take appropriate actions to mitigate this risk.
Top findings by severity
This widget displays the top results for findings that triggered a risk alert after scanning resources, ordered by severity.
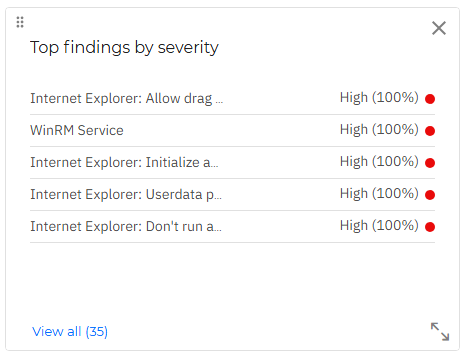
If you click an individual finding in this widget, it is opened in the Findings page, in a new tab, where you may take appropriate actions to mitigate the risk.
If you click the View all link, the entire list of findings is opened in the Findings page, in a new tab.
Note
For more details on findings, refer to Indicators of Risk.
Vertically resizing the widget is limited to displaying 20 lines maximum.
Top findings by impact
This widget displays the top results for findings that triggered a risk alert after scanning resources, ordered by impact.
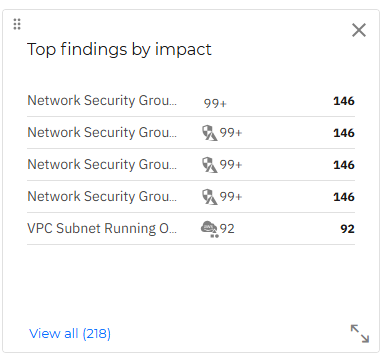
If you click an individual finding in this widget, it is opened in the Findings page, in a new tab, where you may take appropriate actions to mitigate the risk.
If you click the View all link, the entire list of findings is opened in the Findings page, in a new tab.
Note
For more details on findings, refer to Indicators of Risk.
Top vulnerabilities by severity
This widget displays the top results for known application vulnerabilities that triggered a risk alert after scanning resources, ordered by severity.
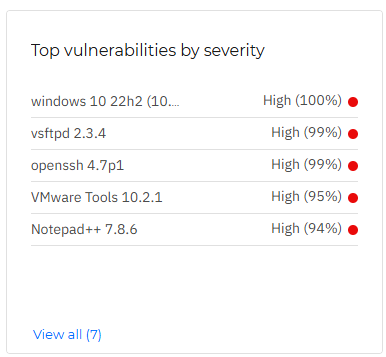
Clicking an individual item in this widget opens it in the Vulnerabilities page in a new tab, where you may take appropriate actions to mitigate this risk.
If you click the View all button, you will view the entire list of vulnerabilities in the All vulnerabilities smart view of the Vulnerabilities page, ordered by risk score.
Hovering over an individual device within the widget displays its risk score breakdown.
Top account risks by impact
This widget displays the top results for potential risks caused by unintentional or reckless behavior of users active in your network, ordered by impact.
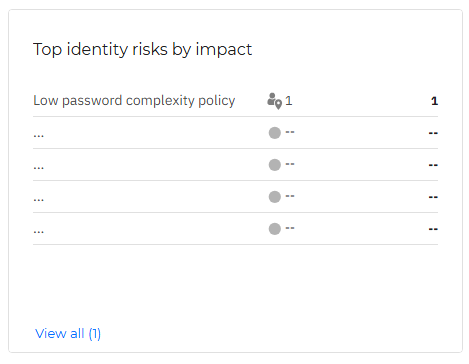
If you click an individual finding in the widget, it is opened in the Account risks page, in a new tab, where you may take appropriate actions to mitigate the risk.
If you click the View all link, the entire list of findings is opened in the account risks page, in a new tab.
Note
For more details about user data processing, refer to Identity risk data collection
Top account risks by severity
This widget displays the top results for potential risks caused by unintentional or reckless behavior of users active in your network, ordered by severity.
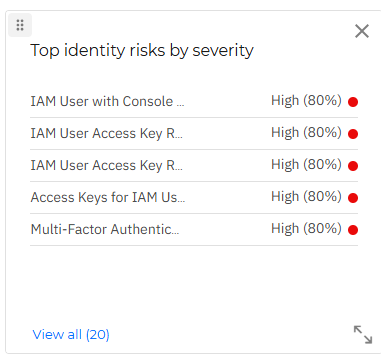
If you click an individual finding in the widget, it is opened in the Account risks page, in a new tab, where you may take appropriate actions to mitigate the risk.
Note
For more details about user data processing, refer to Identity risk data collection.
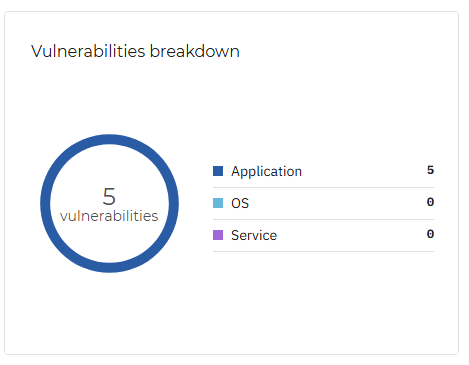
Vulnerabilities breakdown
This widget breaks down the vulnerabilities in your company, sorting them by the type of the application in which the vulnerability can be found - Application, OS, or Service.
Top vulnerabilities by impact
This widget lists the vulnerabilities in your company, sorted by impact.
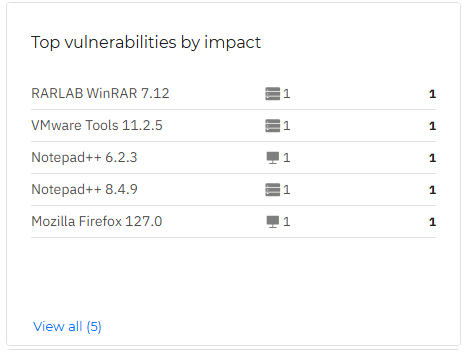
Clicking an individual item in this widget opens it in the Vulnerabilities page, in a new tab, where you may take appropriate actions.
If you click the View all button, you will view the entire list of vulnerabilities in the All vulnerabilities smart view of the Vulnerabilities page, ordered by risk score, descending.
Hovering over an individual item in the widget displays the container image number and the total number of affected resources.
Top resources at risk
This widget shows the resources that are most at risk in your company.
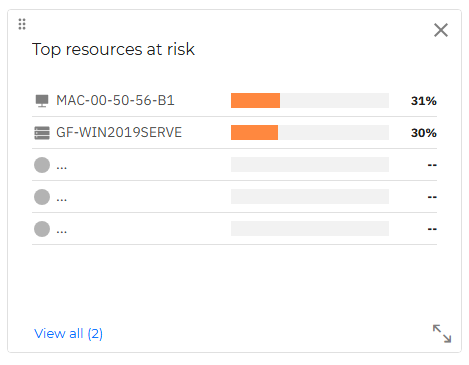
If you click an individual finding in this widget, it is opened in the Resources page, in a new tab, where you may take appropriate actions to mitigate this risk.
If you click the View all button you will view the entire list of resources in the All resources smart view of the Resources page, ordered by risk score. Hovering over an individual device within the widget displays its risk score breakdown.
Top accounts at risk
This widget displays the most vulnerable accounts in your environment, according to the overall score calculated after analyzing their behavior and activity.
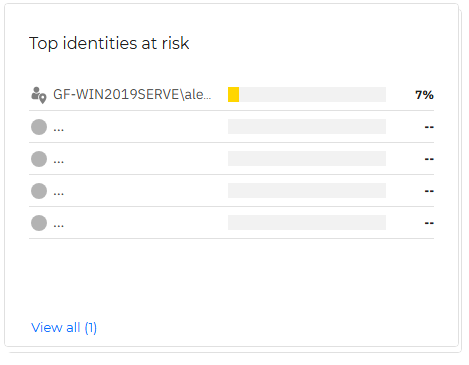
If you click an individual identity in this widget, it is opened in the Account risks page, in a new tab, where you may take appropriate actions that are present for that identity.
If you click the View all link, the Account risks page is opened in a new tab.
Top resources involved in incidents
This widget highlights the top resources that have been involved in incidents, listing their name, risk score and amount of incidents in which the resource was involved.
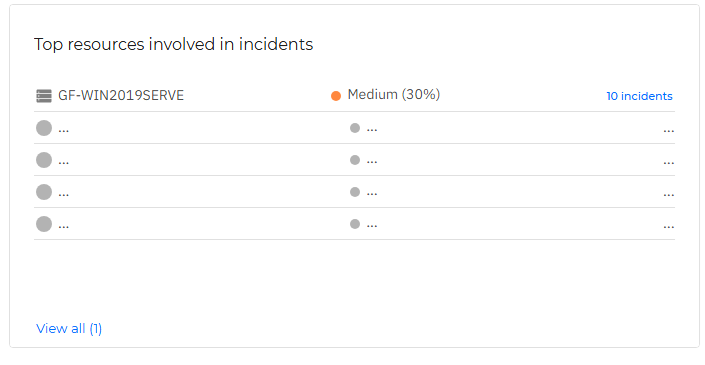
If you click an individual finding in this widget, it is opened in the Resources page, in a new tab, where you may take appropriate actions to mitigate the risks present on that resource.
If you click the View all button, you can view the entire list of incidents in the Resources page.
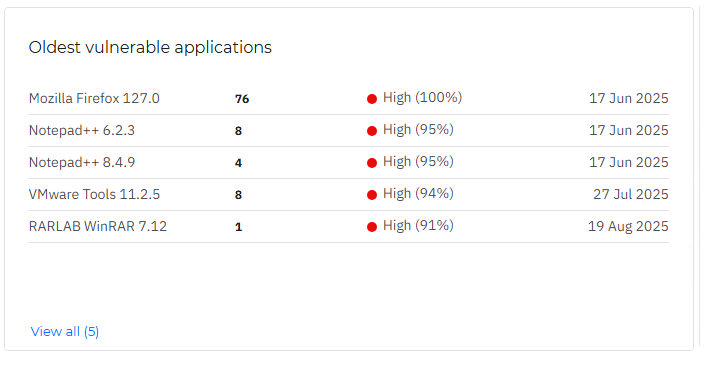
Oldest vulnerable applications
This widget lists the applications that are oldest and most vulnerable, listing their risk score, number of vulnerabilities and date they were first seen on.
Vulnerabilities by severity
This widget lists all vulnerabilities by their severity, displaying their total number and how many are being actively exploited. For each vulnerability you can view its name as shown in the CVE database, a link that leads to the CVE database page, and its risk score.
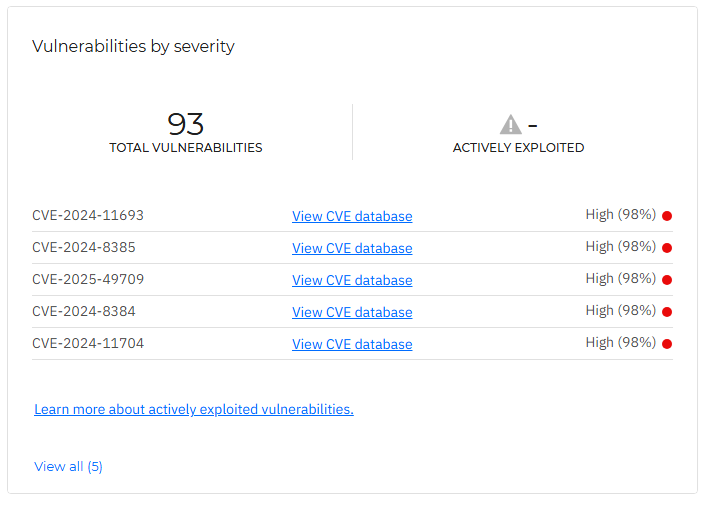
If you click the View all button, you can view the entire list of vulnerabilities in the Vulnerabilities page.
Vulnerabilities by application
This widget lists all vulnerabilities by the application they have been discovered on, their total number, and how many are being actively exploited. For each application, you can view its name as shown in the CVE database, the number of vulnerabilities per each application, and the associated risk score.
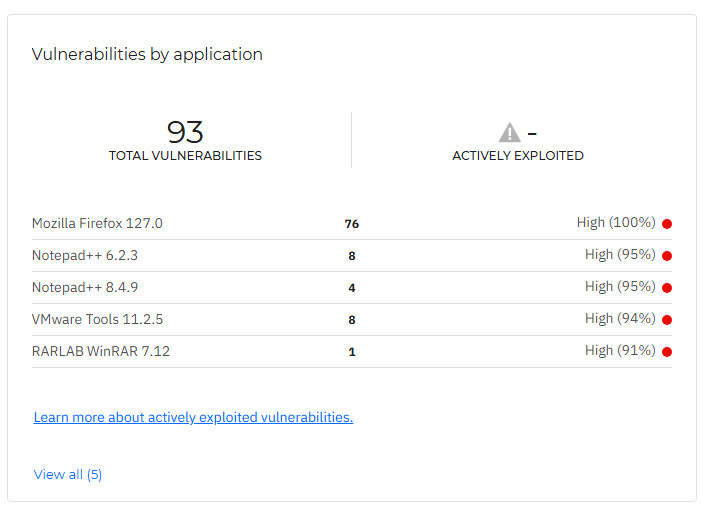
If you click the View all button, you can view the entire list of vulnerabilities in the Vulnerabilities page.