Network inventory
The Network page provides features for exploring and managing all entities available in your network. Entities are defined as physical computers, virtual machines, Security Servers, containers, container clusters, folders, and companies available in your network.
You can easily view the status of these entities, allocate resources, and troubleshoot issues that may arise. Additionally, the page offers a user-friendly interface for seamless navigation and efficient management of network assets.
The Network page contains the following areas:
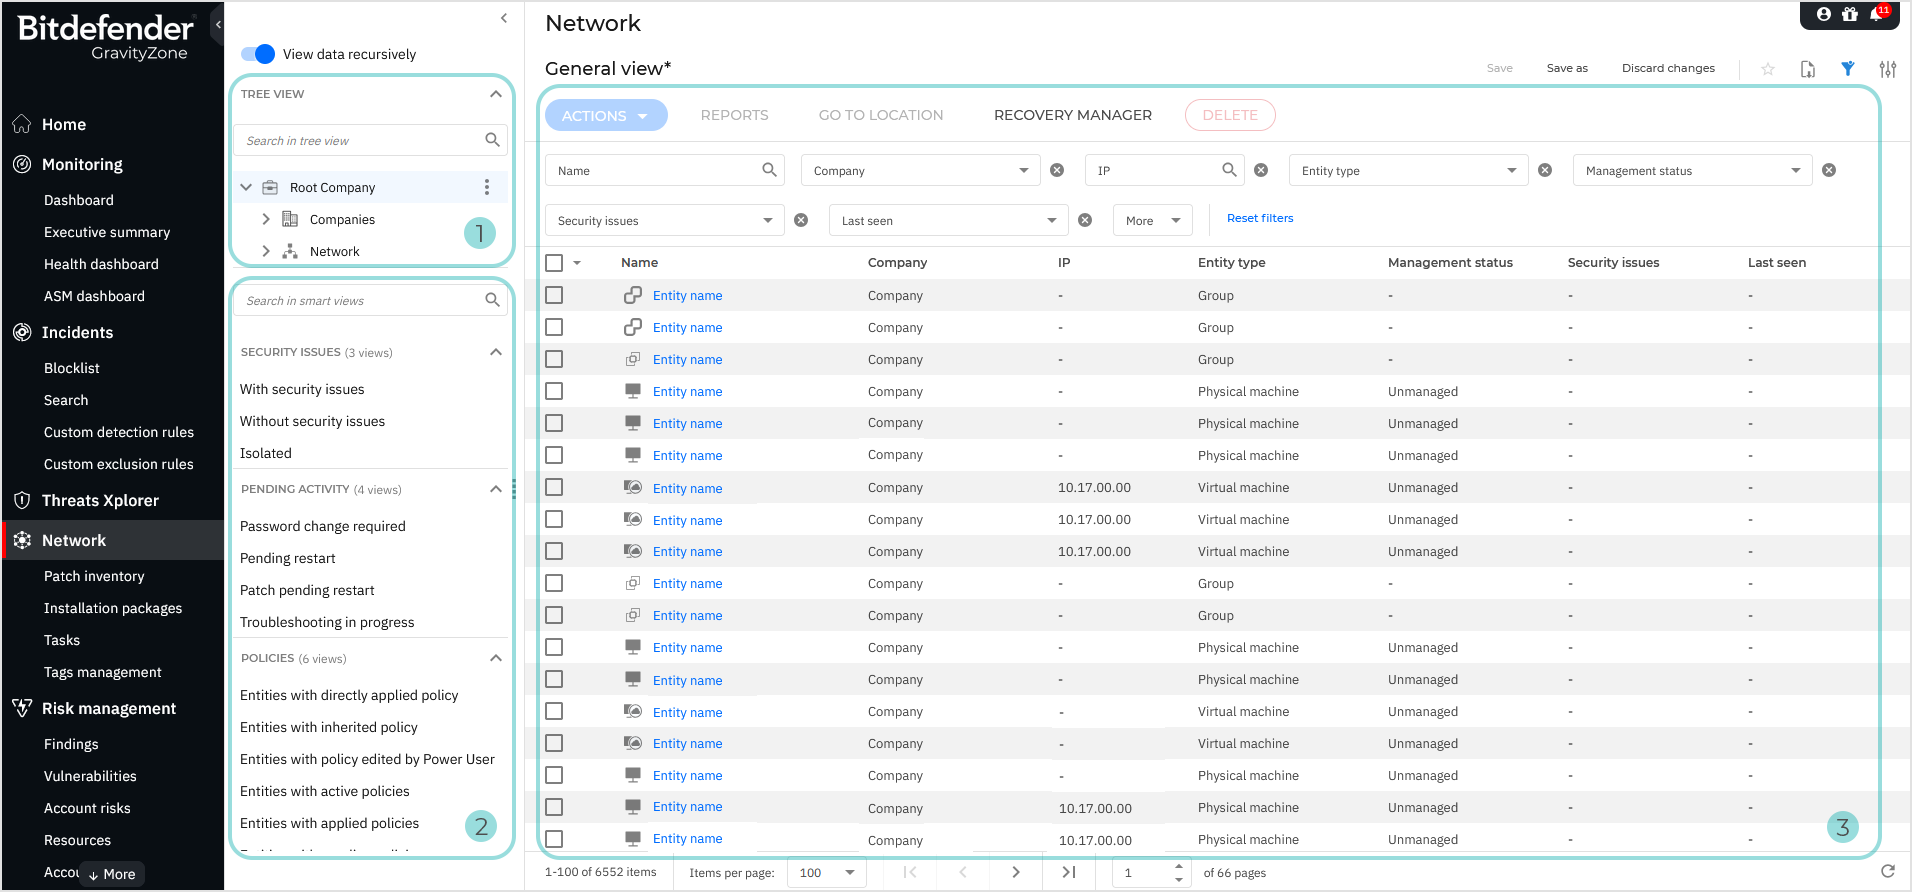
Tree view
Tree view is available in the left-side panel of the Network page and allows you to view your data recursively using the View data recursively toggle. It features the following elements:
The search in Tree view is dynamic, meaning that you can search for an entity by only typing the first characters of its name. You can also use the asterisk (*) as a wildcard, to find names that contain a specific string of characters. For example, use *bc to find a folder named Abcd.
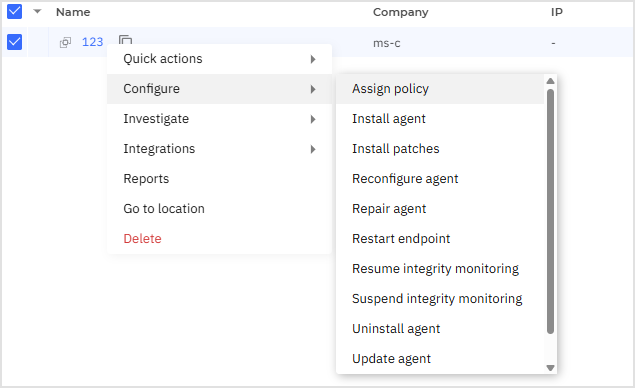
Contextual menu in the Tree view
The contextual menu in the Tree view provides quick access to common actions like:
Create companies
Create groups
Rename entities
Move entities
Delete entities
Assign Security Servers
Assign policy
To access the contextual menu, click the tree-dot menu icon corresponding to an entity in the tree view.
Note
Contextual menu actions are not available for Kubernetes entities and the Container Clusters folder. As a result, the contextual menu is disabled when you select Kubernetes clusters, the Container clusters folder, or any combination of entities that includes these elements.
Table
The table area contains a series of actions, filters, columns and other useful actions for ease of usage.
You can easily copy entity details to the clipboard, making it quicker to share or document information. Additionally, GravityZone remembers your network location as you navigate through the platform, providing a more seamless and efficient user experience.
Actions
The Actions menu is located at the top of the Network page.
When taking actions on entities in Network, new tasks are created. You can follow their status on the Tasks page. To learn more about tasks, refer to this Using actions.
You can also use the right-click context menu for single entities or multiple selected entities to quickly access relevant actions through categorized drawers and a searchable interface.
Note
The right-click menu displays only the actions that are usable for the selected entities. Actions that cannot be executed on the selected items are hidden.
Actions are not available for Kubernetes entities and the Container Clusters folder. As a result, the Actions menu is disabled when you select Kubernetes clusters, the Container clusters folder, or any combination of entities that includes these elements.
Reports
The Network page enables centralized reporting for monitoring security policies, assessing network security status, identifying issues, detecting threats, monitoring incidents, and providing easy-to-understand data for upper management. For more details, refer to Reports.
Go to location
The Go to location function replaces the previous Go to container behavior. It can be applied to any entity type, shifts the tree view to the selected collection, retains the current filters, and is only available for single selections. If no item or multiple items are selected in the table, the action is disabled.
Recovery manager
If endpoint users forget their encryption passwords and can no longer access encrypted volumes on their machines, you can assist them by retrieving recovery keys from the Network page. For details, refer to Using Recovery Manager for encrypted volumes.
Filters and columns
This section includes a range of filters and columns to help surface relevant data efficiently. Only some of them are displayed by default.
To add or remove columns, click the  Settings button in the upper right-side corner of the table.
To add or remove filters, click the More option at the upper side of the table.
For details on using columns and filters, refer to Sorting, filtering and searching for endpoints.
Smart views
Smart views are saved configurations of the Network table that let you quickly return to a specific view of your data.
They capture the current state of the table, including filters, columns, sorting, and search criteria. This allows you to focus on specific entities or issues without having to reconfigure the table each time.
Smart views are available under the Tree view. You can create your own views or use predefined ones, switch between them as needed, and share them with other users in your company.
Smart view categories
The following smart view categories are available in the left-side panel. Smart views can be either user-defined (Saved, Shared) or predefined (all other categories):
Shared - Includes customized smart views shared between you and other users in your company, whether created by you or by someone else.
Note
Smart views that you share as a partner are not available to managed companies under your account.
Saved - Includes your customized smart views not shared with other users.
Security issues - Includes predefined views that highlight specific issues in your network.
Pending activity - Includes predefined views related to pending activity and troubleshooting processes.
Policies - Includes predefined views related to policy configuration.
Favorites - Includes views that you marked as favorite by clicking the star icon in the top-right corner of the table.
You can add to favorites only smart views from the Saved category.
Management - Includes predefined views related to management items.
Search smart views
To easily find smart view, use the search box in the left-side panel under the Tree view.
The search in Smart views is dynamic. You can find a view by typing any sequence of characters contained in its name.
For example, typing gen or era returns General view.
Note
Search in smart views does not support wildcards.
Create a customized smart view
To create a customized smart view:
In the Network table, apply the filters you want.
Click Save as at the top of the table.
Enter a name for the view.
Optionally, configure the following settings:
Share this view with users in your company - makes the smart view visible to other users in read-only mode.
Allow users in your company to edit this view - allows other users to modify the smart view.
Changes propagate to all users.
Users working on the same shared view are notified if it was changed or deleted by someone else.
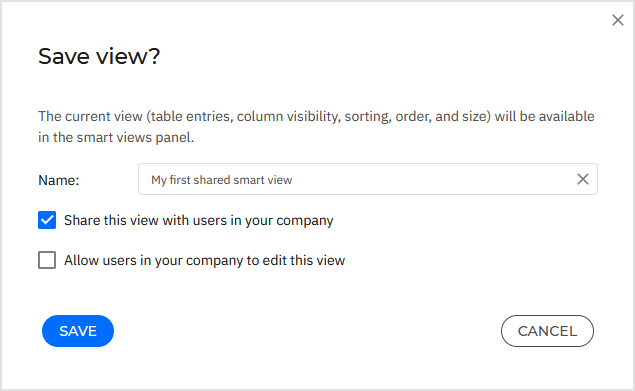
Click Save.
After saving:
If the view is not shared, it is added under the Saved category.
If the view is shared, it is added under the Shared category.
When a shared view is accessed, the following information is displayed next to its title in the Network table area:
Type (read-only or editable)
The user who created the view
Date and time of the last update, and the user who saved the view
Note
When you modify a smart view, you can either save your changes to the existing view or use Save as to create a new one.
Predefined views cannot be overwritten.
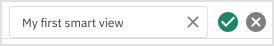
Share a personal smart view
To share a personal smart view:
In the left-side panel, go to the Saved category.
Click the corresponding three-dot icon to open the menu.
Click Share.
In the configuration window, optionally change the name.
By default, the suffix
[Shared]is added to avoid naming conflicts with your personal smart view. You can modify the name as needed.Optionally, select Allow users in your company to edit this view to make the view editable by other users.
Click Share.
The smart view is added under the Shared category.
Sharing a smart view is recorded in the User activity section under:
Area: Network
Action: Created
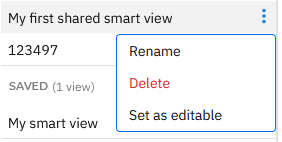
Make a shared view editable
If you shared a smart view as read-only, you can make it editable:
In the left-side panel, go to the Shared category.
Click the corresponding three-dot icon to open the menu.
Click Set as editable.
In the confirmation window, click Set as editable.
The shared view becomes editable to all users in your company.
Setting a shared view as editable is recorded in the User activity section under:
Area: Network
Action: Edited
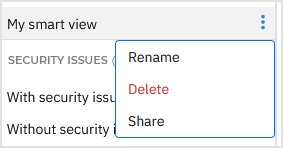
Rename a smart view
To rename a smart view:
In the left-side panel, go to the Saved or Shared category.
Click the corresponding three-dot icon to open the menu.
Click Rename.
Enter the new name.
Click the confirmation button to save the changes.
Alternatively, click the cancel button to exit without saving.
Changes to a shared smart view name are visible to all users.
Renaming a shared view is recorded in the User activity section under:
Area: Network
Action: Renamed
Delete a smart view
To delete a smart view:
In the left-side panel, go to the SavedShared
Click the corresponding three-dot icon to open the menu.
Click Delete.
Confirm the action.
The smart view is deleted.
Shared smart views are deleted for all users.
If a shared view is deleted while another user is editing it, that user is notified when attempting to save.
Deleting a shared view is recorded in the User activity section under:
Area: Network
Action: Deleted
Guided tour
When you first access the Network page, a guided tour will start, walking you through six key areas of the interface. Each step includes options to Learn more, View later, or Close (X) the tour. Clicking Exit tour (on the last card) or the X button will permanently close the tour, and it won’t be shown again.
If you select View later or simply navigate away, your progress is saved and the tour will resume the next time you access the Network section, unless you paused on the first slide, in which case it restarts.