Create reports in Splunk based on GravityZone data
This section explains how to create reports based on the events received from GravityZone in Splunk.
As a Bitdefender partner, you can integrate GravityZone with Splunk by using HTTP Event Collector and GravityZone APIs. Thus, you are able to send data from GravityZone Control Center directly to Splunk Enterprise or Splunk Cloud.
Create reports manually in Splunk
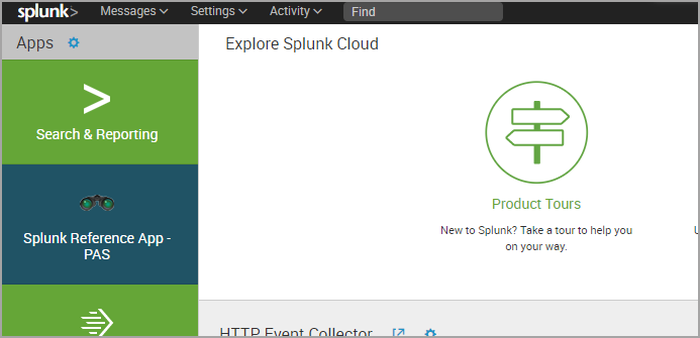
Log in to Splunk and go to Search & Reporting.
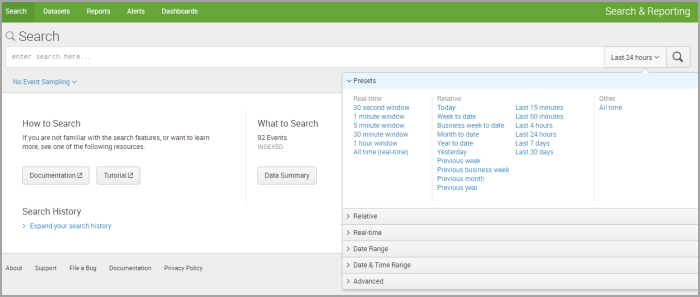
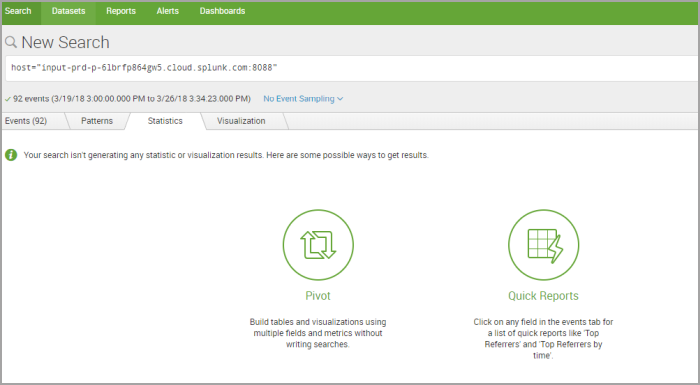
In the Search screen, select the interval that you are interested in and click Data Summary.
In the new window, select your host associated to GravityZone.
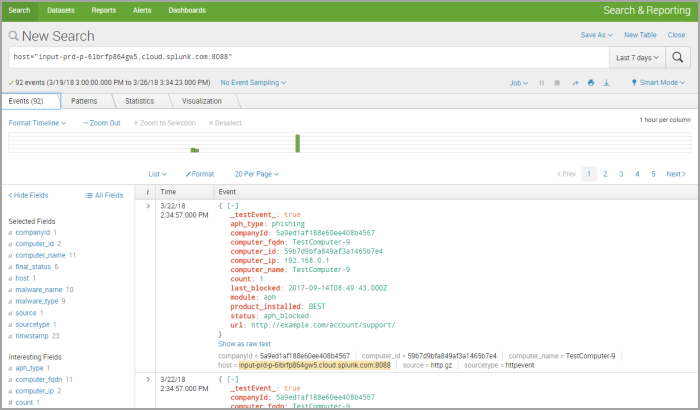
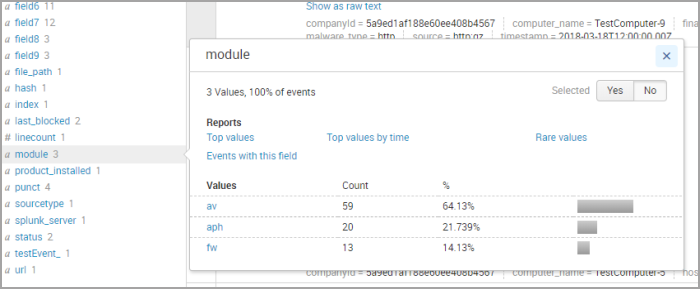
In the Events screen, from the left-side menu, select events to build your reports.
Click Yes in the window to confirm your selection.
For example, to build an Antimalware report, select any of the following events:
module
product_installed
companyId
computer_name
computer_fqdn
computer_ip
computer_id
malware_type
malware_name
hash
final_status
file_path
timestamp
The results will be displayed in the right-side panel.
You can configure the report as you want by selecting any kind of event. However, the GravityZone reports are defined by certain events. You can find the reports and their associated events in Public API.
If you want other events, follow these steps:
Click + Extract New Fields at the end of the list.
In the new screen, select one event and click Next at the upper side of the page.
Select Delimiters and click Next.
Choose a delimiter, preferably Comma.
The events appear in separate fields. Click them for renaming, if you need it.
Under Save, at Extractions Name, enter a name.
Click Finish.
After configuring the events, click the Statistics tab.
Click Pivot.
In the new windows, choose Selected Fields and click OK.
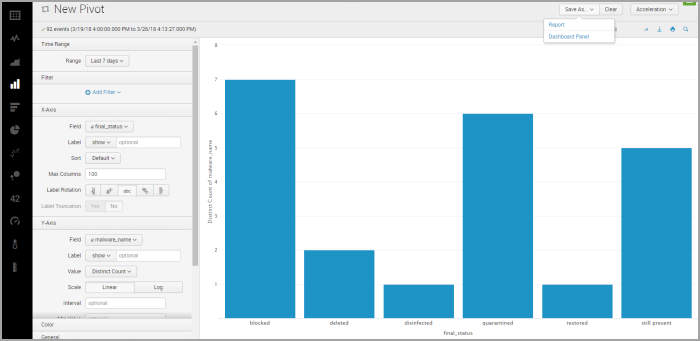
In New Pivot, choose the preferred type of chart and configure it.
Example
Select Column Chart.
In the time rage, select the desired interval (e.g. last 7 days).
Under X-Axis, at Field, select
final_status.Under Y-Axis, at Field, select
malware_name.The chart will show you the status of the malware detected in the last 7 days in your network.
Click Save As… at the upper side of the chart and select Dashboard Panel.
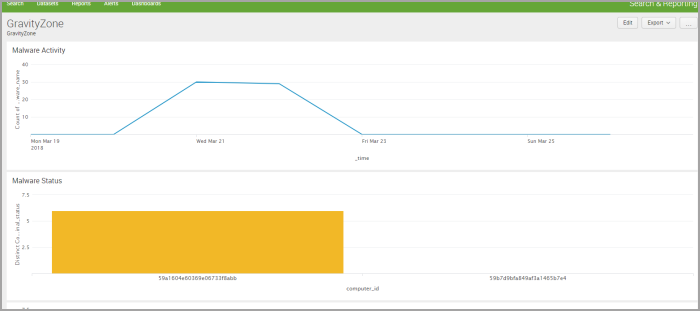
In the new window, fill in the required data. You can either create a new dashboard or edit an existing one.
Click Save. The chart is now in your preferred dashboard. You can create your own GravityZone dashboard, with multiple charts, as shown the picture below.
Create reports by using Bitdefender GravityZone for Splunk app
Bitdefender GravityZone for Splunk app helps you predefine and view dashboards, reports and search for events. This application works together with Bitdefender GravityZone Add-on for Splunk.
For proper functioning with GravityZone Control Center, install these products on the Splunk platform in this order:
Install Bitdefender GravityZone Add-on for Splunk. Click here to download.
Install Bitdefender GravityZone for Splunk App. Click here to download.