The Network sensor
The Network sensor collects and pre-processes network-related events in order to enrich the context of your incidents.
It is configured in TAP mode and gets a copy of the network traffic via a SPAN port. It can detect any type of device that communicates via IPv4 or IPv6 network protocols, regardless of whether the device is managed by Bitdefender or not. If there are any IoT devices on the network that communicate using those same protocols, the Network sensor will inspect that traffic as well.
For more information about the Network sensor requirements, refer to the Network sensor requirements page.
Note
The Network sensor does not support SCADA or any particular OT protocols.
After configuration, the Network sensor continuously listens to network traffic, collects events from all endpoints in your environment, pre-processes and pre-filters them, and sends both metadata and detections to GravityZone Security Analytics engine.
View the triggered detections in the Incidents > Search section, by using the following query: other.sensor_name:network. These detections are used to enrich the context of Extended Incidents generated by GravityZone.
Preparing your environment for the Network Sensor Appliance deployment
Before deploying the Network Sensor Virtual Appliance (NSVA) for GravityZone XDR, take the following steps to prepare your environment:
Tip
The NSVA appliance supports monitoring more than one network subnet with a single appliance.
Ensure all network subnet requirements are met:
Non-overlapping IP address spaces - Networks monitored by a single NSVA appliance must not have overlapping IP address spaces.
This is crucial to avoid event correlation inconsistencies and ensure accurate monitoring.
Non-duplicated MAC addresses - Networks monitored by a single NSVA appliance must not contain duplicated MAC addresses.
This is crucial to avoid event correlation inconsistencies and ensure accurate monitoring.
Network routers information - A list of IP and MAC addresses for the routers handling traffic for the monitored subnets. These will be required during setup.
A NSVA network sensor appliance will need to be configured to monitor at least one subnet and be provided with at least an internet gateway and/or router for each of the monitored networks.
Configure the NSVA Group ID.
The group ID is a user-defined integer value that is configured on each NSVA appliance and allows for partitioning of the network monitoring in case overlapping address spaces are present in your infrastructure.
Please consider the following guidelines:
The NSVA Group ID can have values between 1 and 254.
NSVA appliances with the same group ID must not monitor network subnets with overlapping address spaces.
Use the same group ID for appliances monitoring distinct subnets with non-overlapping IP address spaces or duplicated MAC addresses. This helps GravityZone treat that network site as a consistent partition of the environment and correlate events across its entirety.
Avoid configuring more than one NSVA appliance within the same group ID to monitor the same network subnet.
Each network subnet should be monitored only once within the same GravityZone company to avoid redundant monitoring and potential data conflicts and duplication
If your infrastructure does not have subnets with overlapping address spaces that need to be monitored within the same GravityZone company, you should let all the NSVA network sensor appliances to use the default group ID value (1).
Set up traffic monitoring.
The NSVA appliance monitors network traffic using mirroring (also known as SPAN) switchport sessions. Depending on your network equipment, different terminologies might be used.
One NSVA appliance can monitor traffic from multiple networks over the same network interface, through a session that mirrors traffic from one or more network segments or switch ports. The NSVA appliances can monitor traffic delivered via SPAN, RSPAN or mirroring
Important
Ensure that your network hardware supports SPAN or mirroring sessions to facilitate traffic delivery to the network sensor appliance.
By following these prerequisites, you can ensure the successful deployment of the NSVA network sensor appliance, and set up comprehensive and conflict-free network monitoring.
Install the Network sensor
You can deploy the Network sensor in your environment by using the prebuilt appliance images for vSphere, Hyper-V, Proxmox, OVHcloud Private Cloud, or you can install it manually.
These steps must be followed to deploy the Network sensor probes in your environment. For hardware requirements see Network sensor requirements.
Go to the Network > Installation Packages page from the left side menu in GravityZone Control Center.
Select the Network Sensor Virtual Appliance package.
Click the
 Download button at the upper side of the table and choose VMware (OVA) from the menu.
Save the selected package to the desired location.
Open the vSphere client, and click File > Add OVF template to import the OVF template for the Network Sensor Virtual Appliance (NSVA) that will be used to configure and activate the Network sensor in your environment.
Click Local file and select the previously downloaded package.
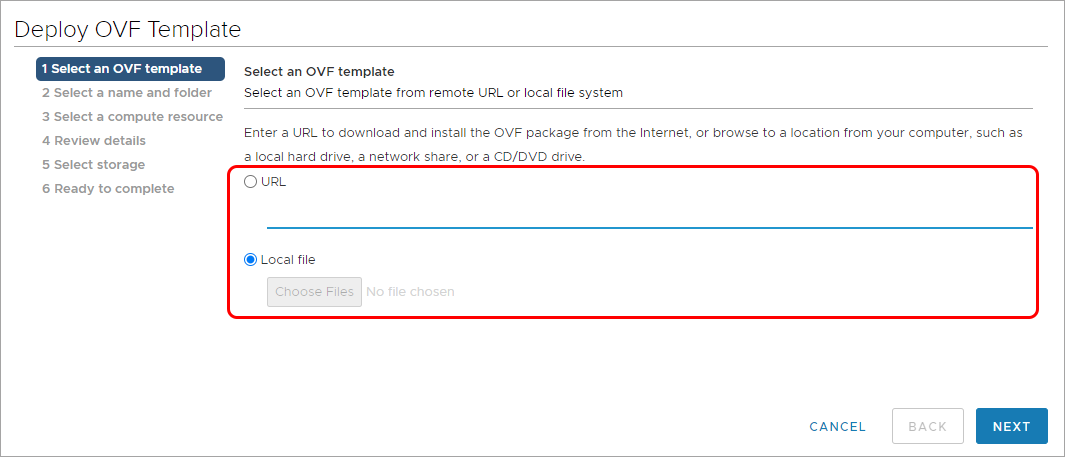
Click Next.
Name the Network Sensor Virtual Appliance and select the deployment location.
Click Next.
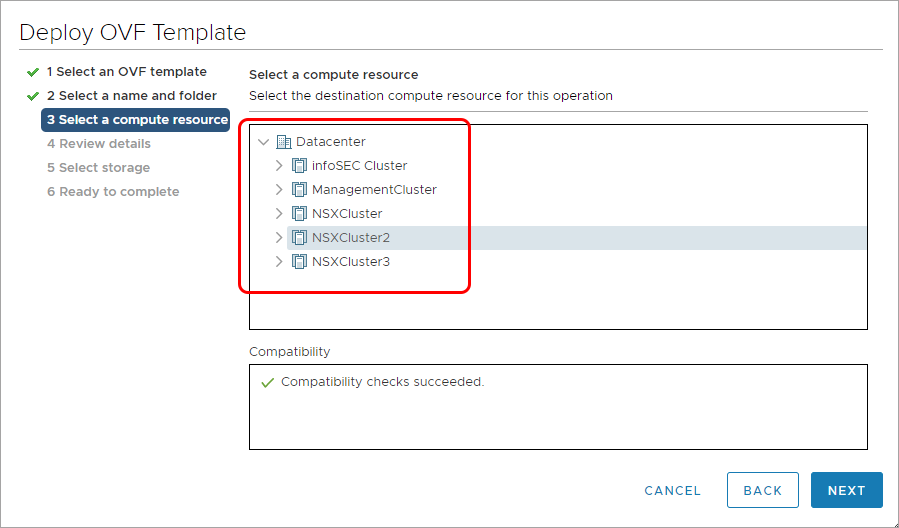
Select the target endpoints in your environment where to deploy the Network sensor probes and then click Next.
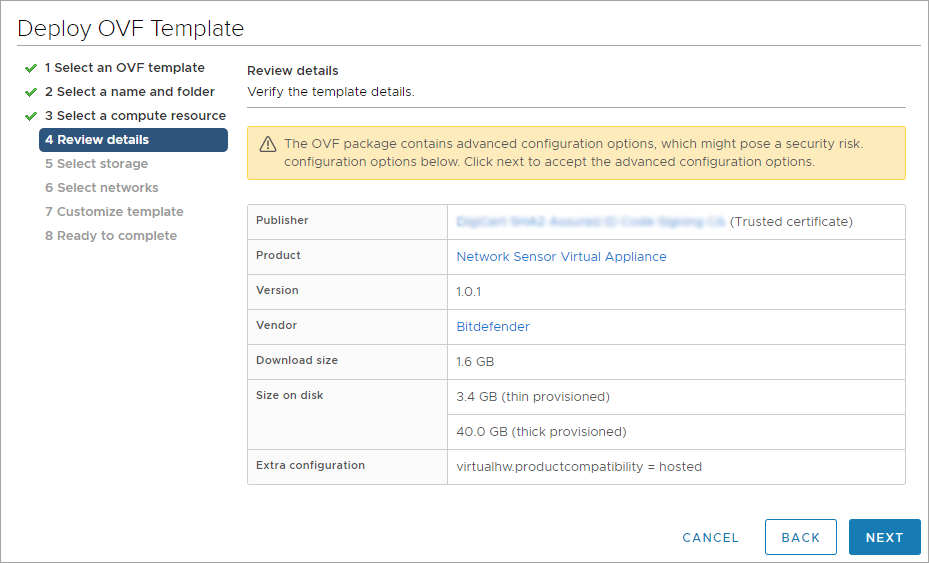
Verify the details of your NSVA template and click Next.
On the Select storage page, define where and how to store the files for the deployed NSVA template.
Select the disk format for the virtual machine virtual disks.
Choose from the available options:
Thick Provision Lazy Zeroed
Thick Provision Eager Zeroed
Thin Provision
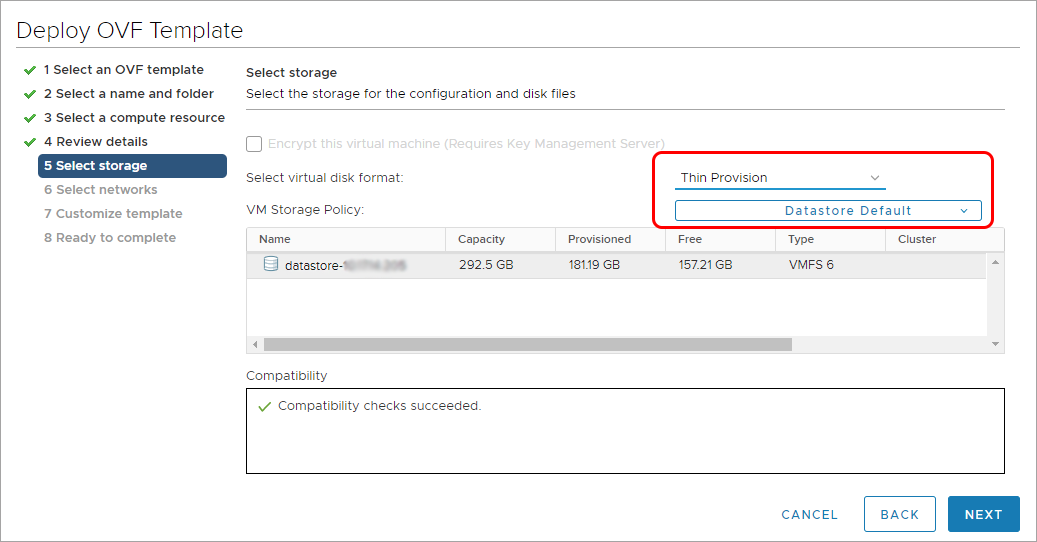
Select a storage policy.
Note
This option is available only if storage policies are enabled on the target endpoints.
Select a datastore to store the deployed NSVA template.
The configuration file and virtual disk files are stored on the datastore. Select a datastore large enough to accommodate the virtual appliance and all associated virtual disk files.
On the Select networks page:
Select the network interface that establishes communication between the Network sensor appliance and GravityZone.
Select the SPAN network that will be monitored by the Network sensor probes.
Important
After deployment, the monitored network's subnet must be set in the network sensor by running the
sva_setup.shscript. For more information, refer to the Network Sensor configuration.
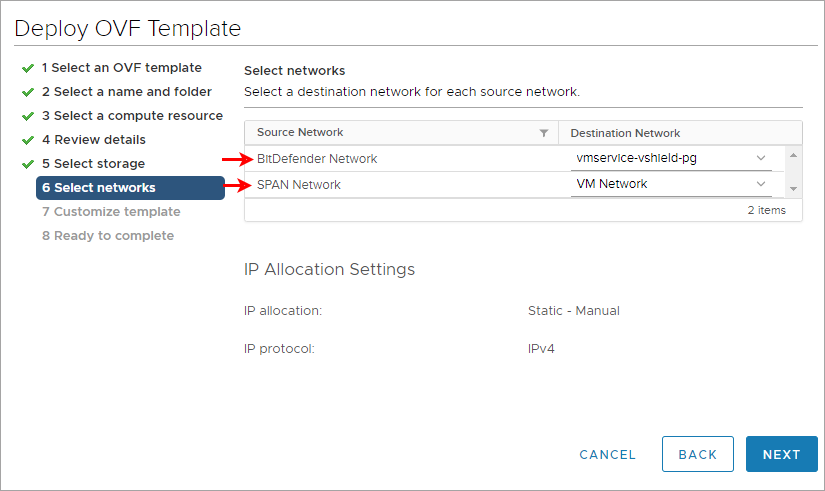
Click Next.
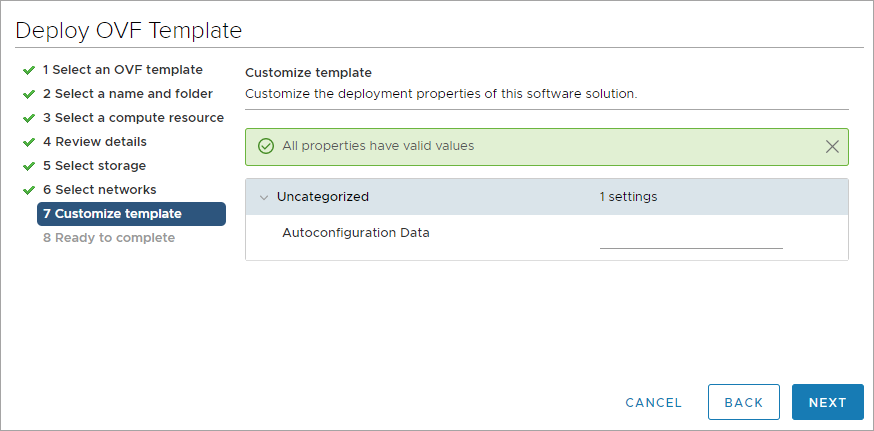
Optionally, customize the NSVA deployment properties and click Next.
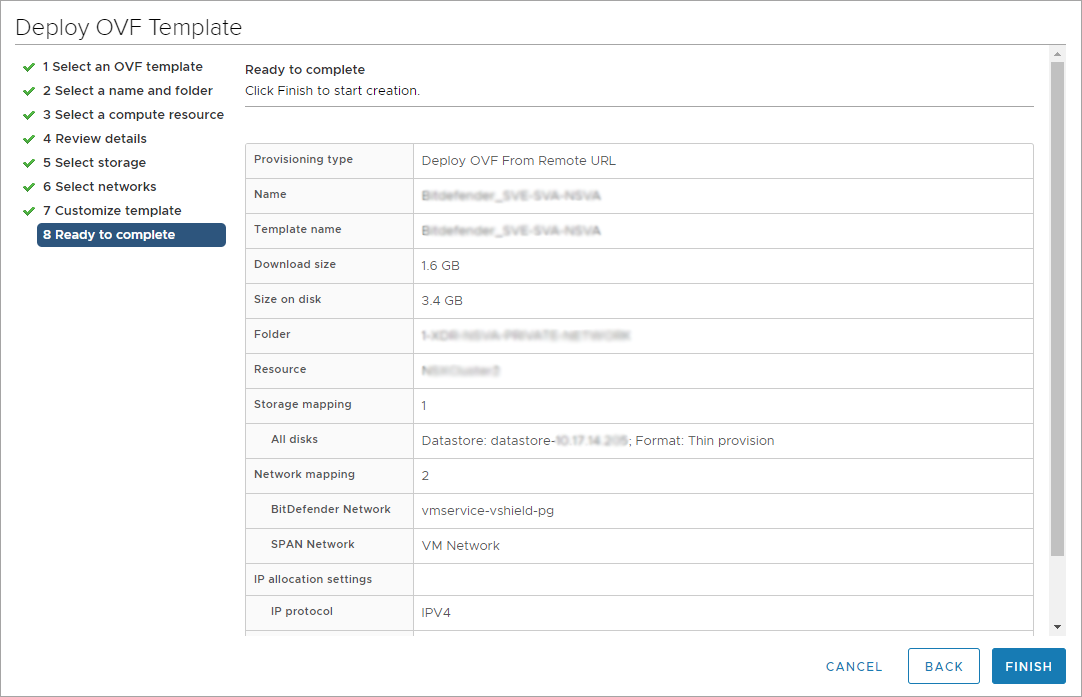
On the Ready to complete page, review the details and click Finish.
After the creation task is completed, open your Network sensor virtual appliance and start the configuration process.
These steps must be followed to deploy to deploy the Network sensor probes in your environment. For hardware requirements see Network sensor requirements.
Go to the Network > Installation Packages page from the left side menu in GravityZone Control Center.
Select the Network Sensor Virtual Appliance package.
Click the
Download button at the upper side of the table and choose Microsoft Hyper-V (VHD) or Microsoft Hyper-V Gen 2 (VHDX) from the menu.Save the selected package to the desired location.
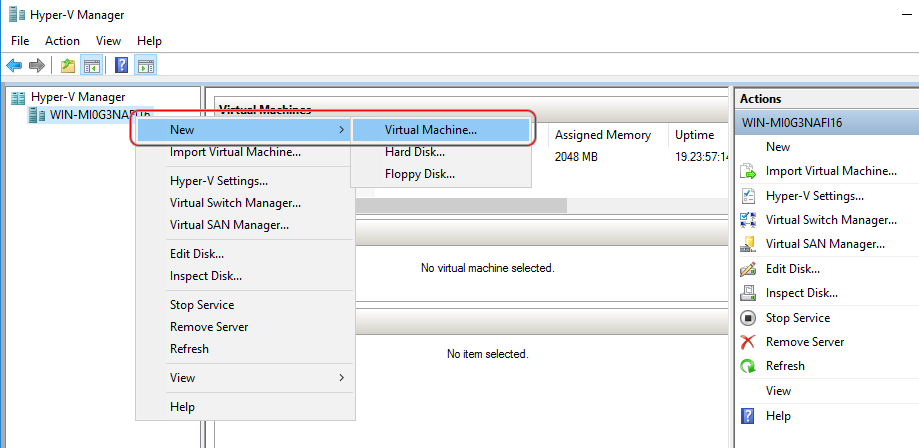
Open Hyper-V Manager and from the Action pane click New > Virtual Machine... to create a virtual machine that will be used to configure and activate the Network sensor in your environment.
In the Before You Begin window, click Next to create a virtual machine with a custom configuration.
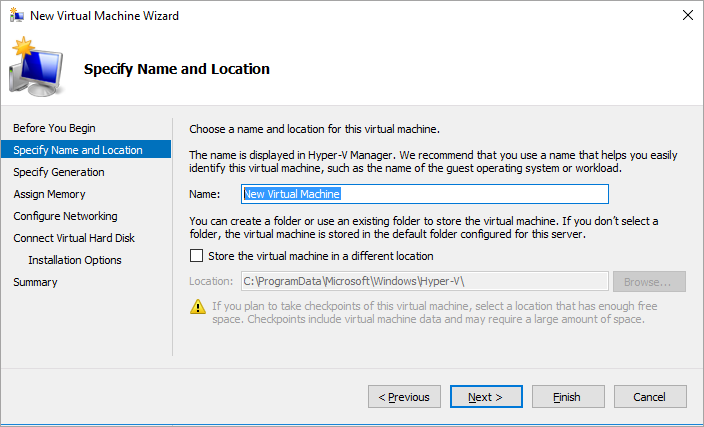
In the Specify Name and Location window, add your virtual machine name and the location where the image was downloaded.
In the Specify Generation window you must:
Select Generation 1 if you have downloaded the
.vhdimage type.Select Generation 2 if you have downloaded the
.vhdximage type.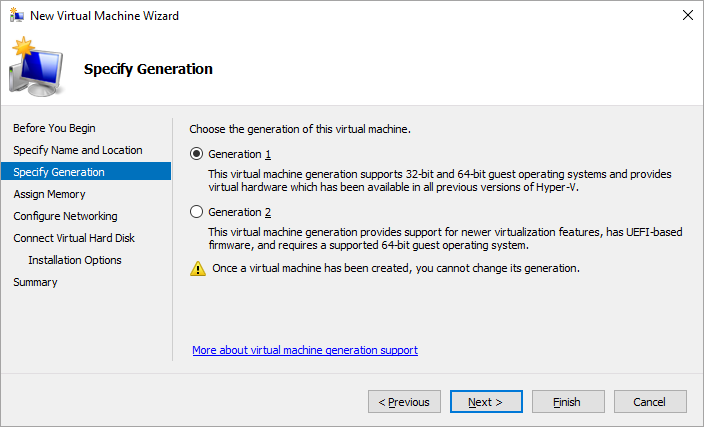
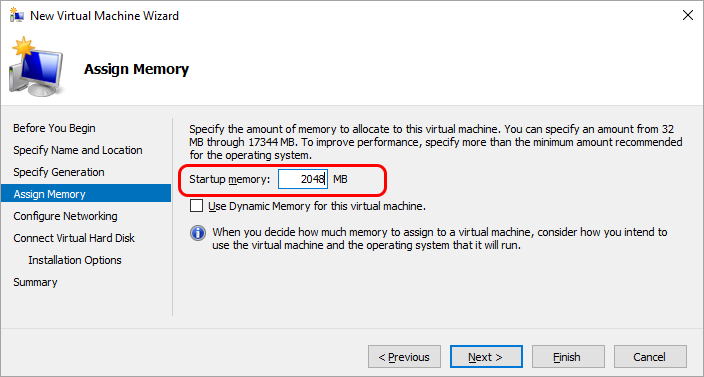
In the Assign Memory window, set the Startup memory to 2048 MB.
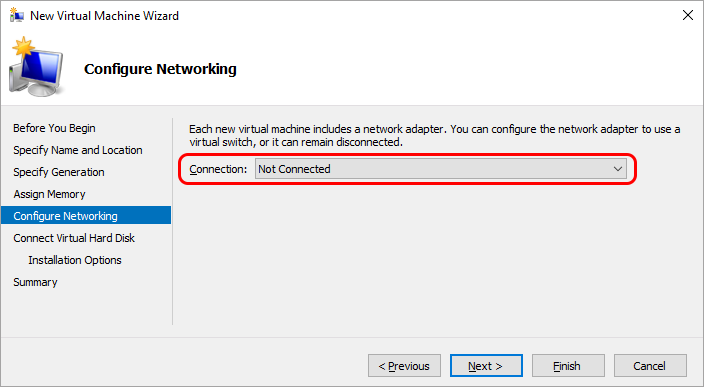
In the Configure Networking window, set the Connection to the desired network interface.
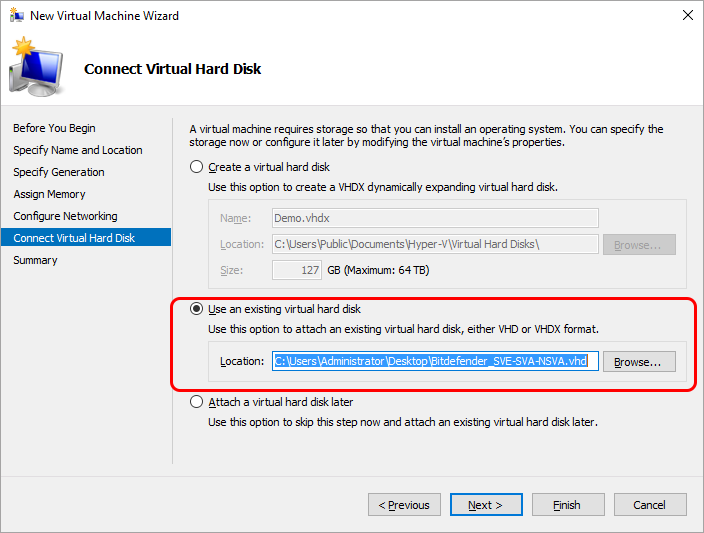
In the Connect Virtual Hard Disk window select the Use an existing virtual hard disk option and browse for the location of the downloaded Network sensor VHD or VHDX kit.
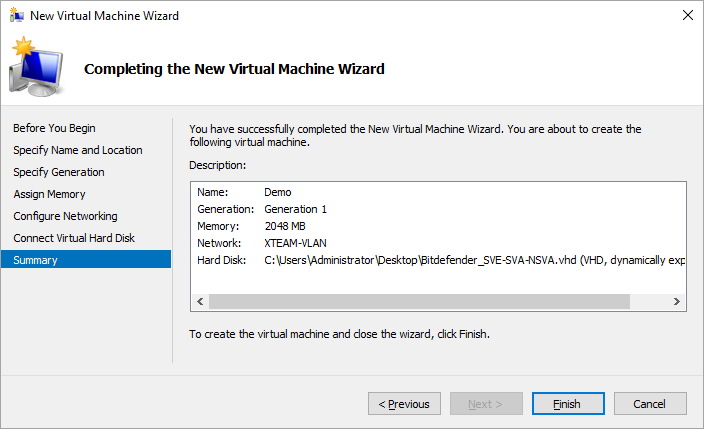
In the Summary page, review the details and click Finish.
In Hyper-V Manager right-click the newly created virtual machine, and go Settings.
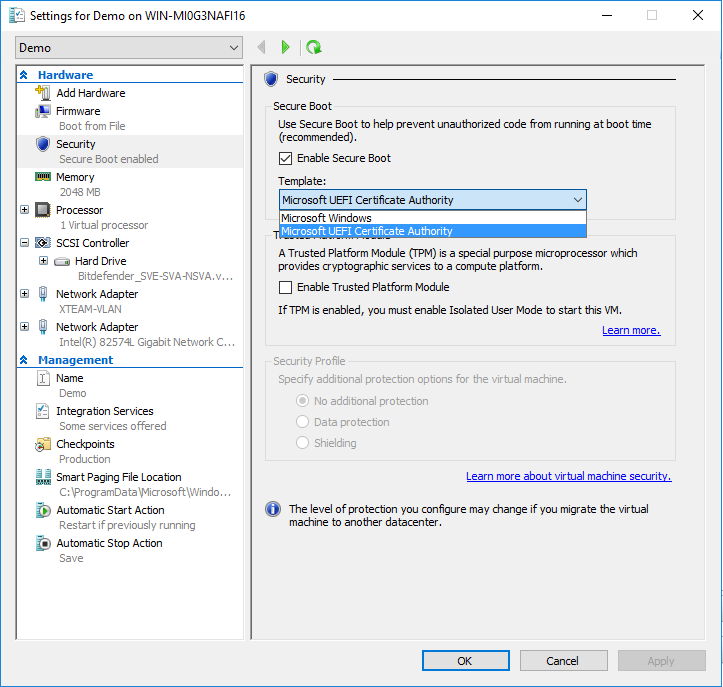
If the Generation 2 virtual machine was selected, go to Security and select Microsoft UEFI Certificate Authority from the Template dropdown list.
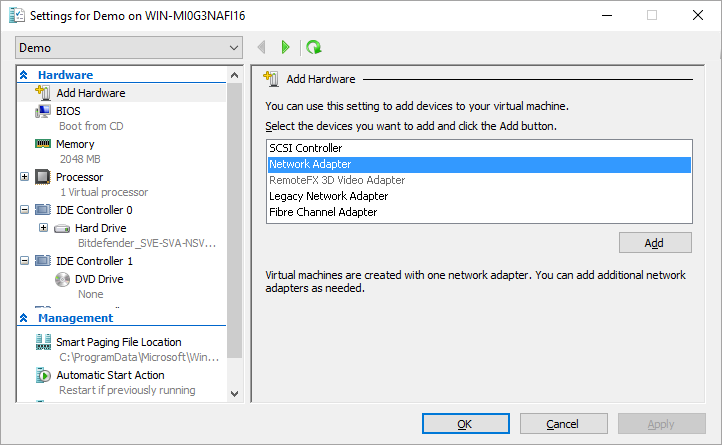
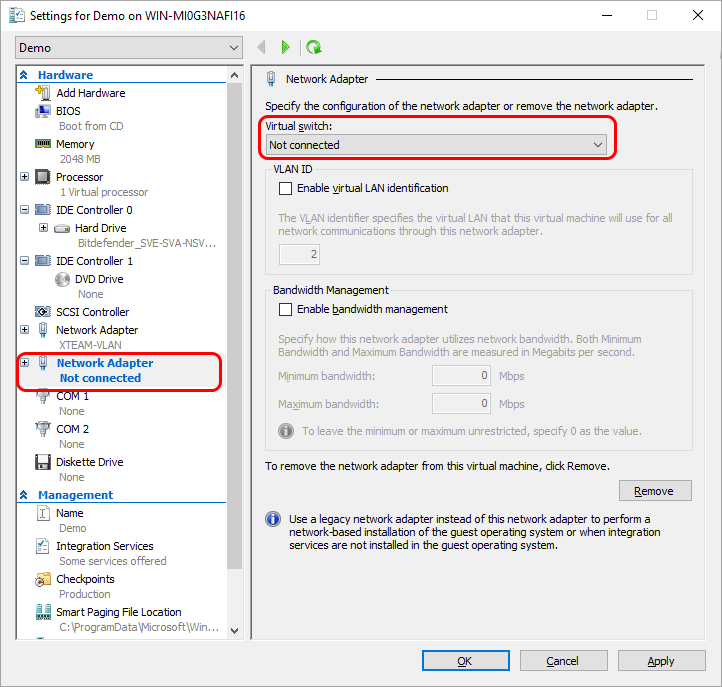
Go to Add Hardware and select Network Adapter to add the SPAN network that will be monitored by the Network sensor probes.
Important
After deployment, the monitored network's subnet must be set in the network sensor by running the
sva_setup.shscript. For more information, refer to the Network Sensor configuration.Select the desired SPAN network and click Apply .
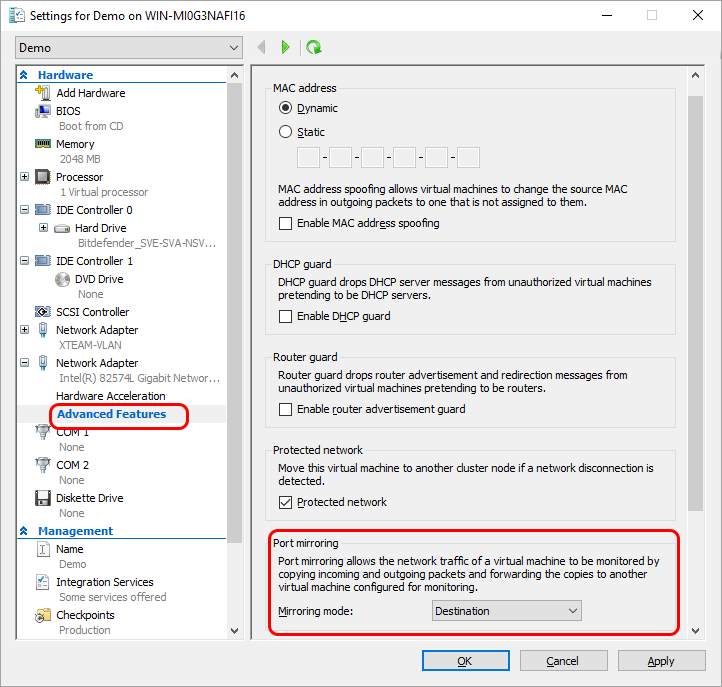
Open Advanced Features of the SPAN network adapter and set the Port mirroring mode to Destination, then click Apply.
Start the Network sensor virtual machine and begin the configuration process.
These steps must be followed to deploy the Network sensor probes in your environment. For hardware requirements see Network sensor requirements.
Go to the Network > Installation Packages page from the left side menu in GravityZone Control Center.
Select the Network Sensor Virtual Appliance package.
Click the
Download button at the upper side of the table and choose VMware (OVA) from the menu.Save the selected package to the desired location.
Open the OVHcloud Private Cloud VMware platform, and click File > Add OVF template to import the OVF template for the Network Sensor Virtual Appliance (NSVA) that will be used to configure and activate the Network sensor in your environment.
Click Local file and select the previously downloaded package.
Click Next.
Name the Network Sensor Virtual Appliance and select the deployment location.
Click Next.
Select the target endpoints in your environment where to deploy the Network sensor probes and then click Next.
Verify the details of your NSVA template and click Next.
On the Select storage page, define where and how to store the files for the deployed NSVA template.
Select the disk format for the virtual machine virtual disks.
Choose from the available options:
Thick Provision Lazy Zeroed
Thick Provision Eager Zeroed
Thin Provision
Select a storage policy.
Note
This option is available only if storage policies are enabled on the target endpoints.
Select a datastore to store the deployed NSVA template.
The configuration file and virtual disk files are stored on the datastore. Select a datastore large enough to accommodate the virtual appliance and all associated virtual disk files.
On the Select networks page:
Select the network interface that establishes communication between the Network sensor appliance and GravityZone.
Select the SPAN network that will be monitored by the Network sensor probes.
Important
After deployment, the monitored network's subnet must be set in the network sensor by running the
sva_setup.shscript. For more information, refer to the Network Sensor configuration.
Click Next.
Optionally, customize the NSVA deployment properties and click Next.
On the Ready to complete page, review the details and click Finish.
After the creation task is completed, open your Network sensor virtual appliance and start the configuration process.
Network Vulnerability Scanner
The Network Vulnerability Scanner is a new capability of XDR Network Sensor Virtual Appliance and a component of Risk Management. It actively scans the network for open ports, identifies running applications, and detects known vulnerabilities (CVEs) associated with those applications.
This functionality enables proactive risk assessment and strengthens endpoint security by providing visibility into network-exposed services and their potential weaknesses.
Requirements and limitations
A scan interface must always be set to Static mode. This can be configured in Network configuration.
The Network Vulnerability Scanner discovers services with known vulnerabilities (CVEs) and displays them in GravityZone only for managed endpoints in your network.
Scan interface limitations:
Each target subnet must be associated with only one network interface.
You can configure up to 9 interfaces in Static mode.
You can only configure 1 interface in Promiscuous mode.
The maximum number of supported interfaces is 10.
Note
Make sure that there are no overlapping or duplicate subnets when configuring multiple interfaces.
The following validation rules apply to subnets configured in the vulnerability scanner:
A maximum of 160 scan targets are allowed.
Note
If more than 160 subnets are configured, only the first 160 are going to be scanned.
Subnets must contain at most ~2 million hosts, meaning that CIDR prefix length must be up to
/11.Only private subnets within the Internet Assigned Numbers Authority (IANA) private IP ranges are allowed:
Range
CIDR
Class A private
10.0.0.0/8Class B private
172.16.0.0/12Class C private
192.168.0.0/16
Network Vulnerability Scanner setup
The Network Vulnerability Scanner requires at least one network interface to be configured with a static IP address. While your system may use DHCP for general connectivity, you must make sure that at least one interface, potentially the same one, is set to Static mode so it can be selected for scanning operations.
This capability automatically selects the appropriate interface to scan each subnet. It chooses an interface that can reach the target subnet with at most one network hop, ensuring that the target machine’s MAC address is directly resolvable.
If the destination requires more than one network hop (for example, it's located behind a gateway), the scanner will only detect the MAC address of the gateway. This information alone is not enough for accurate scanning.
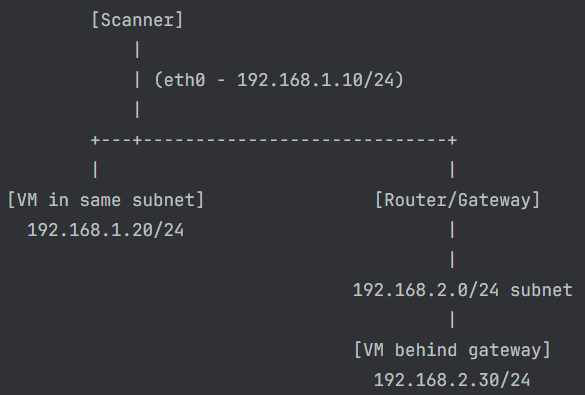
Example of a vulnerability scanner setup:
Note
If exclusions are not applied, endpoints will generate alerts while being scanned by the XDR NSVA, ultimately blocking the scan.
The scanner can directly scan the 192.168.1.20 IP address using eth0, because it's in the same subnet, is one hop away, and the MAC visible.
It won't scan the 192.168.2.30 IP address through the router, because:
The packet would be routed.
The destination MAC would be that of the gateway, not the VM.
Configure the Network Vulnerability Scanner
In GravityZone go to your policy.
Enable Risk management.
For more information, refer to Configuring policies.
Open
sva-setup.Select Configure vulnerability scanner.
Note
The scanner will only function if the network interface is configured in Static mode.

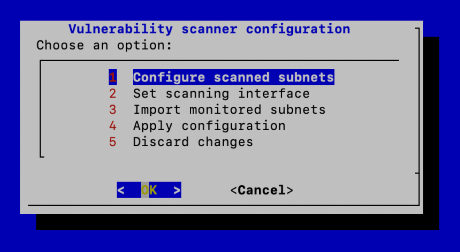
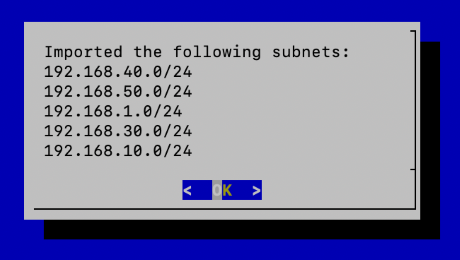
Select Configure scanned subnets > Add new subnet.
(Optional) You can also import existing subnets from the Monitored Networks section.
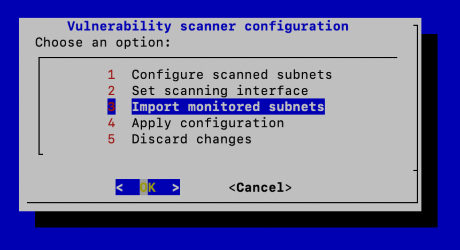
Confirm the list of subnets.
Go to Set scanning interface.
Use the
Spacebar to select one or more interfaces.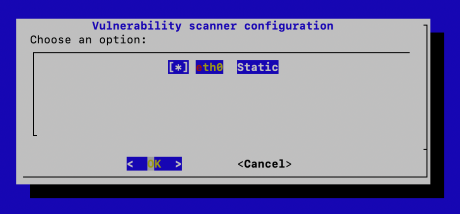
Note
Interfaces selected for scanning must be in Static mode.
Once all settings are configured, select Apply configuration.
Scanning exclusions
You can automatically exclude XDR NSVA IPs that are used when scanning for vulnerabilities if Risk management is enabled in the policy for an endpoint.
After the setup process is completed, all Static IPs set for the Network Vulnerability Scanner are going to be sent to GravityZone and applied as exclusions from Firewall and Network Attack Defense for all endpoints that have the Exclude NSVA IPs from scanning option enabled in the policy.
Note
If exclusions are not applied, endpoints will generate alerts while being scanned by the NSVA, which will eventually block the scan.
You need to individually enable the exclusion for each policy you use on endpoints. In addition, you should configure Assignment rules for policies that apply exclusions on endpoints only when they are in the same network as the XDR NSVA.
Important
To avoid a security breach in which the same policy that excludes the XDR NSVA IPs is applied to an endpoint, both when it is connected to the VPN and when it switches networks, you must configure an assignment rule that ensures exclusions are applied only on safe networks. A potential attacker could use the XDR NSVA IPs from a private network and take advantage of the IP exclusions from the firewall.
Run an on-demand network vulnerability scan
You can scan for network vulnerabilities by running a risk scan task with the Network scan option enabled. The network scan is available on the following pages under the Risk management section:
Findings
Vulnerabilities
Account risks
Resources
Identities
Important
This scan requires at least one XDR NSVA to be installed in your network.
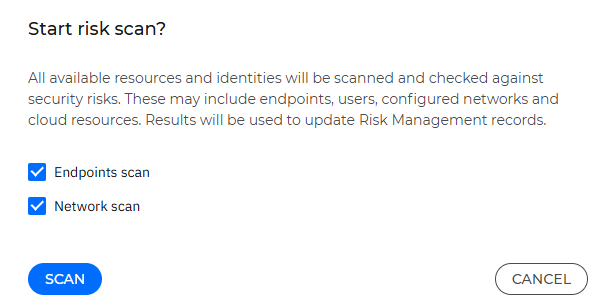
Results are displayed in Risk management > Vulnerabilities.
Use the Vulnerability Scanner in Proxmox VE
To use the Vulnerability Scanner in Proxmox VE, you need to manually specify the number of interfaces. To do that, follow these steps:
Power off the VM.
Add the number of interfaces you want to use.
Integrate with Microsoft’s New Azure virtual network terminal access point (TAP)
XDR Network Sensor Virtual Appliance integration with Azure vTAP can be configured to ingest network traffic by configuring the Security Server monitoring interface as a vTAP destination.
Before adding the monitoring interface, you must go to the Azure Marketplace and deploy the XDR NSVA.
The Marketplace VM includes a single interface by default, which is used for communication with GravityZone. To enable monitoring, you can either:
configure the existing interface to monitor traffic
add and configure a separate monitoring interface and attached to XDR NSVA
Configure the existing interface to monitor traffic
To configure the existing interface follow these steps:
Go to the Azure vTAP portal page and configure the Security Server monitoring interface as a destination resource:
Select XDR NSVA interface as the destination resource.
Add the network interfaces of the VMs you want to monitor as sources.
Log in to the VM via SSH using the following command:
ssh -i <ssh_key> azueruser@ip, whereazureuseris the user created on deployment.The following commands need to be run as root, so you must configure the root password using the following command:
sudo sva-setupGo to Network Configuration > View/Edit physical interface(s).
Select Add new virtual interface.
Configure the Source interface as
eth0.This option creates a new network interface that decapsulates VXLAN traffic received on the vTAP endpoint (
eth0).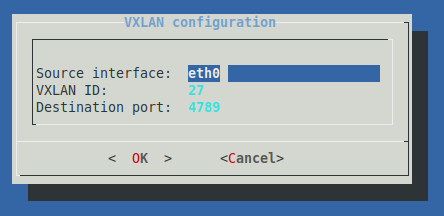
Select Apply Configuration to save the changes.
After the Azure vTAP specific configuration is completed, you must connect the XDR NSVA to GravityZone and configure the monitored networks.
Add and configure a new monitoring interface
To create the monitoring interface, follow these steps:
Stop the VM.
Create and attach a new network interface card (NIC).
Go to the vTAP page to create a new vTAP resource:
Select the new NIC as the destination resource.
Add the network interfaces of the VMs you want to monitor as sources.
Log in to the VM via SSH using the following command:
ssh -i <ssh_key> azueruser@ip, whereazureuseris the user created on deployment.The following commands need to be run as root, please configure the root password using the following command:
sudo passwd rootSwitch to the root user using the following command:
sudo suRun
sva-setup.Go to Network Configuration > View/Edit physical interface(s).
Select
eth1 Unconfiguredand configure it in DHCP mode.Go to View/Edit virtual interface(s).
Select Add new virtual interface.
Configure the Source interface as
eth1.This option creates a new network interface that decapsulates VXLAN traffic received on the vTAP endpoint (
eth1).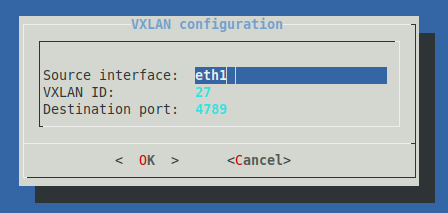
Select Apply Configuration to save the changes.
After the Azure vTAP specific configuration is completed, you must connect the XDR NSVA to GravityZone and configure the monitored networks.
Configure the Network sensor virtual appliance
After installing the Network sensor, follow these steps to configure the virtual appliance:
Start the Network sensor virtual machine.
Log in via SSH using
bdadmin / sveas username and password.Note
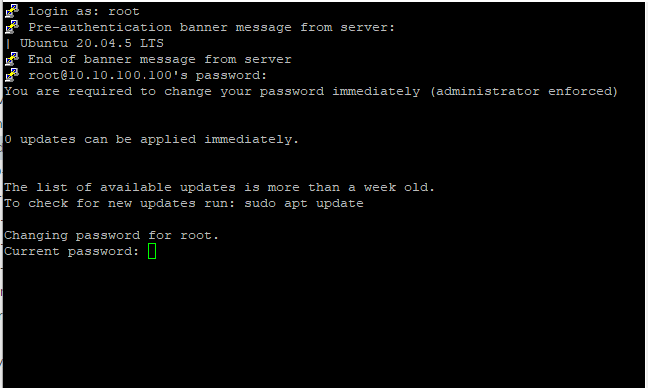
The
rootaccount password issveand it is expired.Change the password.
The default password does not meet the new security password requirements, so you have to change it. It must contain at least 8 characters, one digit, at least one upper case character, at least one lower case character, one special character and must be changed every 3 months.
Note
For more information about resetting the
bdadminpassword, refer to Reset the Security Server password.To configure the Network sensor you can:
Go to Configuration > Sensors Management > Add new > select your company > on the Network Sensor, select Requirements.
Run the listed command on the deployed virtual machine. Afterwards, go to step 10.
Configure the Communication Server with the
sva_setupinterface, running the following command:/opt/bitdefender/bin/sva_setup.sh
The
sva_setupinterface allows for comprehensive network configuration, including the setup of subnets, VLANs, and routers.
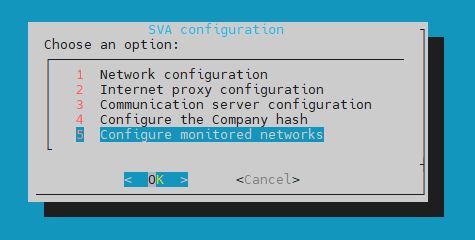
Start the configuration process. Use the arrow keys to navigate and select OK or Cancel to confirm or discard your choices.
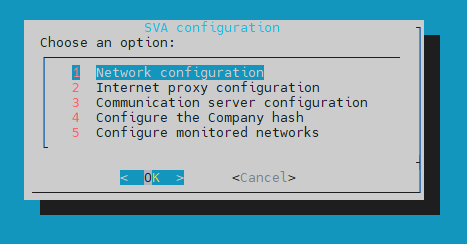
Network configuration - allows setting the following modes:
eth0: this is the primary interface used in the Dynamic Host Configuration Protocol (DHCP) mode to enable communication with GravityZone.Note
This interface can only be configured in DHCP or Static mode, and is always used as the communication interface with GravityZone.
It can also be used for vulnerability scanning, but only when it's set to Static mode.
eth1: this is the interface in promiscuous mode, used to analyze network traffic.
Important
If no changes are needed, no further configuration is required.
If the primary interface must have static IP address, select
eth0from Network configuration and configure it as follows: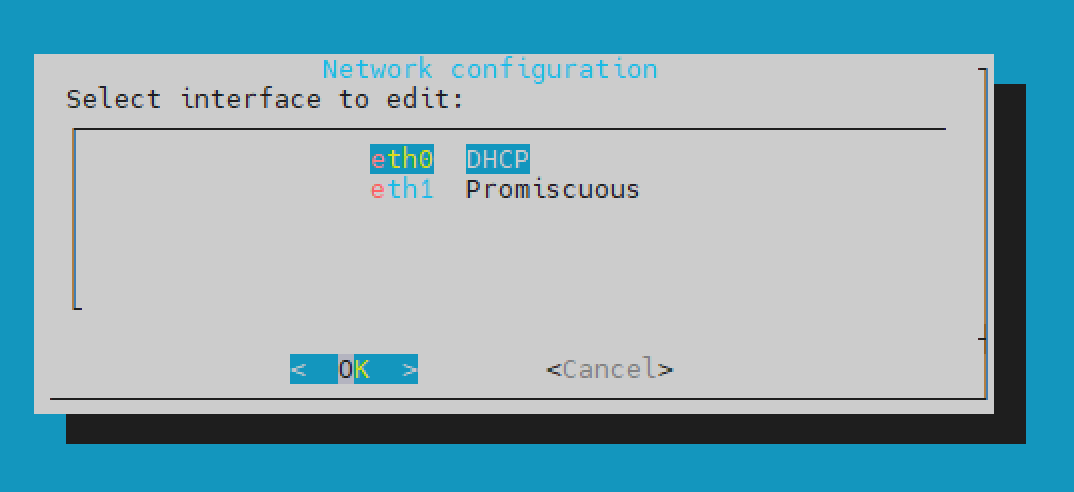
Select Static.
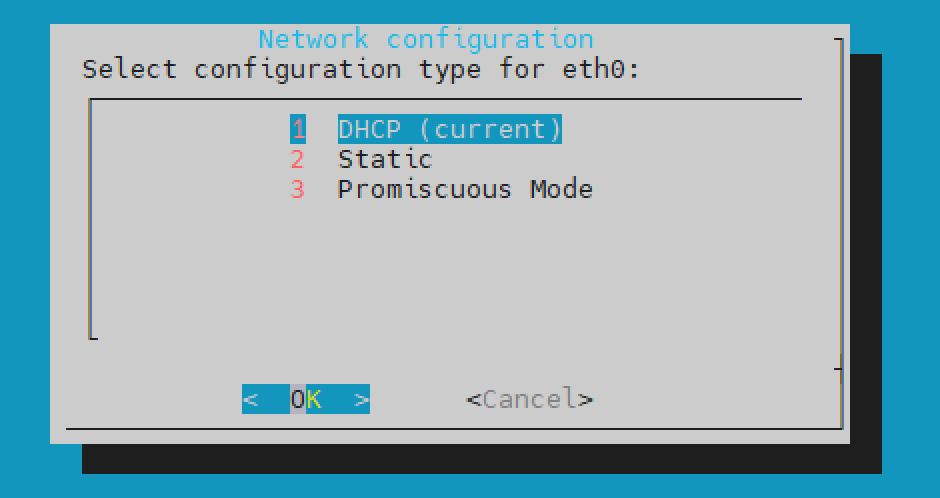
Complete the configuration.
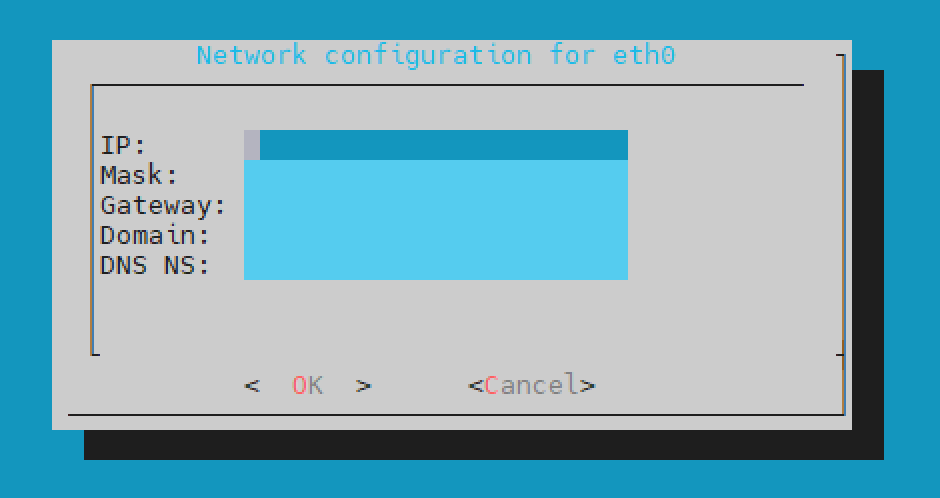
Select Ok.
Select Cancel to return to the Network interface(s) configuration menu.
Select Apply configuration.
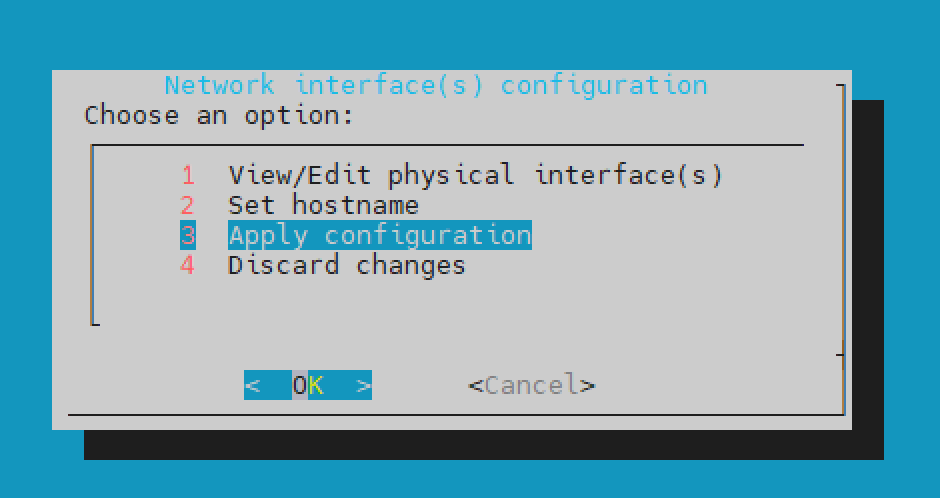
(Optional) You can also change the hostname of the NSVA by selecting the Set hostname option, and then selecting Apply configuration.
Internet proxy configuration - allows setting a proxy configuration that will be used the first time the Network sensor communicates with GravityZone .
Go to Communication server configuration and select one of the following options, based on your browser's URL:
For
cloudgz.gravityzone.bitdefender.com: GZ Cloud Instance 1For
cloud.gravityzone.bitdefender.com: GZ Cloud Instance 2For
cloudap.gravityzone.bitdefender.com: GZ Cloud Instance 3For
cloudrbx.ovh.gravityzone.bitdefender.com: GZ Cloud Instance 4
Note
If you use a relay address, you must add a GZ Cloud Custom Address using the following URL format:
http://<relay-address>:7074Configure the Company hash - the GravityZone company hash where the Network sensor sends the data (Login to GravityZone > My Company > My Company hash).
The Configure monitored networks menu allows you to manage and configure various network settings. For more information on how to prepare your environment for the Network sensor, refer to this section.
Choose one of the following options:
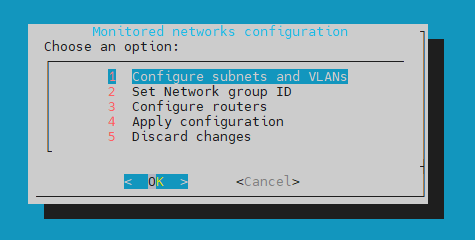
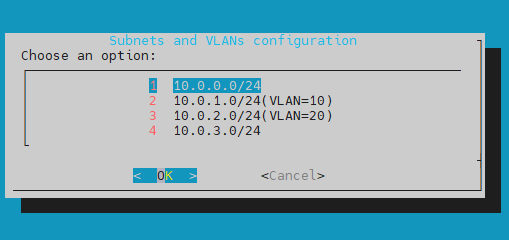
In the Configure subnets and VLANs window you can set up and manage network subnets and Virtual Local Area Networks ID’s (VLAN IDs):

Note
If a subnet is not declared, its traffic won't be monitored even if it reaches the Network sensor.
View/Edit subnet list - here you can view and edit the list of added subnets and VLANs.

Add a new subnet - here you can add a new subnet.
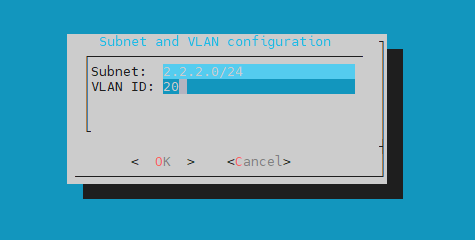
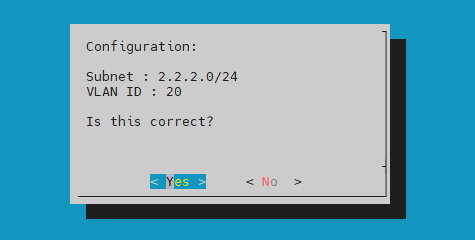
You can configure the monitored subnet address by using the CIDR notation and VLAN ID if the traffic is tagged.
Select Yes to confirm your configuration.
Remove subnet - this options allows you to remove any subnet.
Note
If the traffic is untagged, no VLAN ID is required.
In the Set Network group ID window you can assign or modify the network group identification number:
The group ID must be an integer between 1 and 254.
Unique Group ID for Overlapping Subnets: NSVA appliances with the same group ID must not monitor network subnets with overlapping address spaces.
Consistent Group ID for Non-overlapping Subnets: Use the same group ID for appliances monitoring distinct subnets with non-overlapping IP address spaces.
This is an example of Group ID assignment based on subnets with overlapping address spaces:

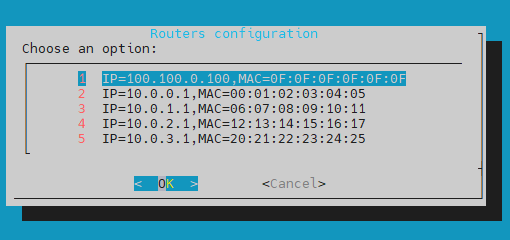
In the Configure routers window you can configure the network routers:
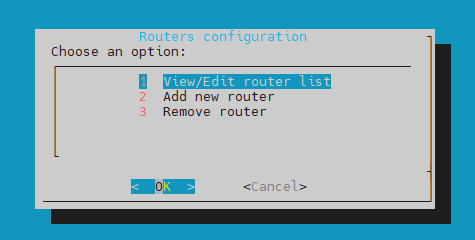
View/Edit router list - here you view and edit the list of added routers.
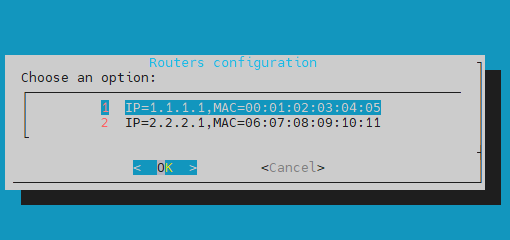
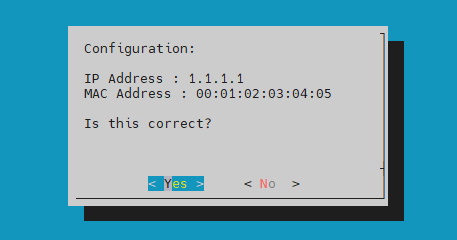
Add new router - this option allows you to add a list of IPs and MAC addresses for different routers and/or internet gateway in the monitored network infrastructure.
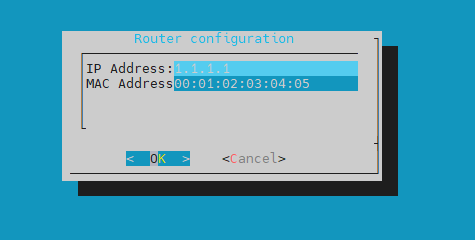
Afterwards you can confirm your configuration by selecting Yes.
Remove router - this option allows you to remove elements from the list of added routers.
After the configuration is complete, select Apply configuration.
If the configuration is incorrect, you can select Discard changes to discard any changes made and revert to the previous settings.
This is an example of a network with multiple subnets:
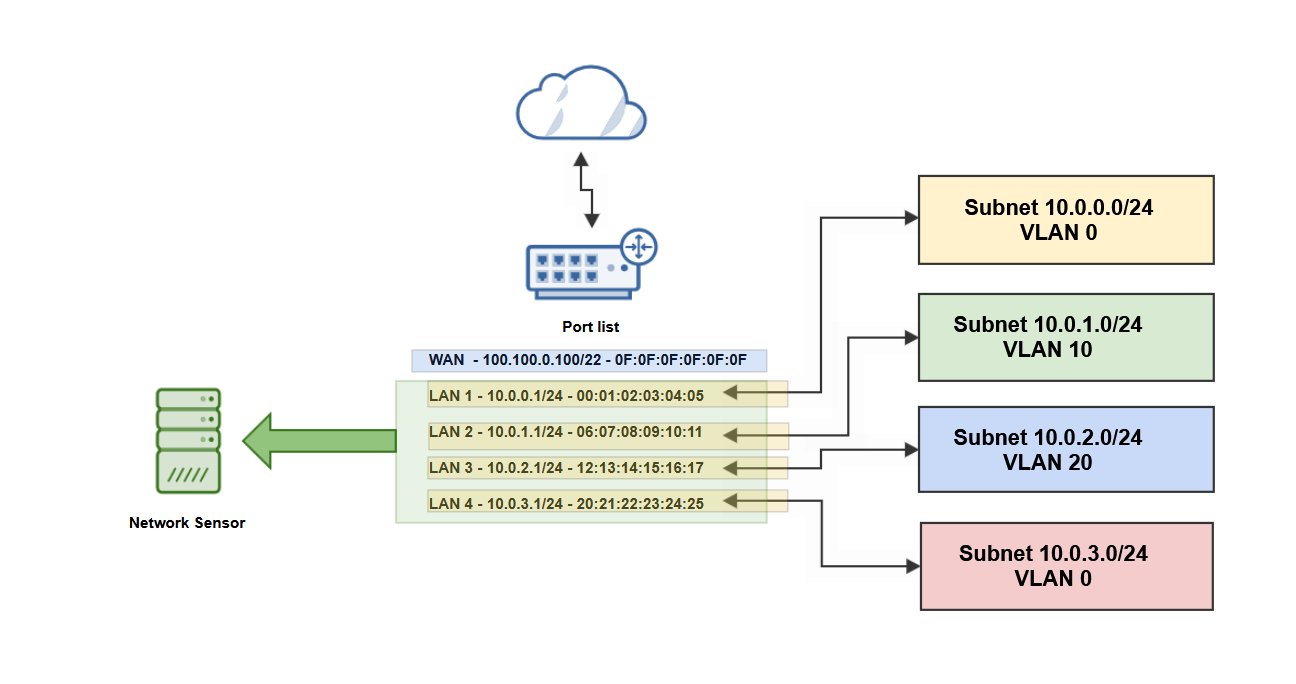
Based on the network configuration diagram, the Network Sensor configuration includes:
subnets and VLANs configuration
routers configuration
(Optional) You can also add the
sva-setupconfiguration based through a JSON file, using the following command in the terminal:sva-setup --monitored-networks network.jsonThe JSON file should contain the list of routers, subnets and the group ID:
{
	"gateways": [
		{
			"ip": "gateway-ip",
			"mac": "gateway-mac"
		}
	],
	"groupId": 1,
	"home_net_vlan": [
		{
			"isTrafficTagged": "yes/no",
			"subnet": "subnet/mask",
			"vlanId": vlanID
		}
	]
}
If the
isTrafficTaggedvariable is set tono, thevlanIdvariable is not required.Here is an example of a JSON file containing the configuration displayed in the example above:
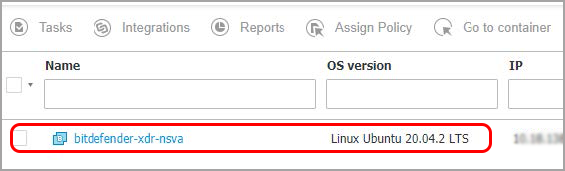
{
	"gateways": [
		{
			"ip": "100.100.0.100",
			"mac": "0F:0F:0F:0F:0F:0F"
		},
		{
			"ip": "10.0.0.1",
			"mac": "00:01:02:03:04:05"
		},
		{
			"ip": "10.0.1.1",
			"mac": "06:07:08:09:10:11"
		},
		{
			"ip": "10.0.2.1",
			"mac": "12:13:14:15:16:17"
		},
		{
			"ip": "10.0.3.1",
			"mac": "20:21:22:23:24:25"
		}
	],
	"groupId": 1,
	"home_net_vlan": [
		{
			"isTrafficTagged": "no",
			"subnet": "10.0.0.0/24"
		},
		{
			"isTrafficTagged": "yes",
			"subnet": "10.0.1.0/24",
			"vlanId": 10
		},
		{
			"isTrafficTagged": "yes",
			"subnet": "10.0.2.0/24",
			"vlanId": 20
		},
		{
			"isTrafficTagged": "no",
			"subnet": "10.0.3.0/24"
		}
	]
}
If the connection is successful, the Network sensor will be displayed in the GravityZone platform, in Network > Computers and Groups (in approximately 30 seconds).
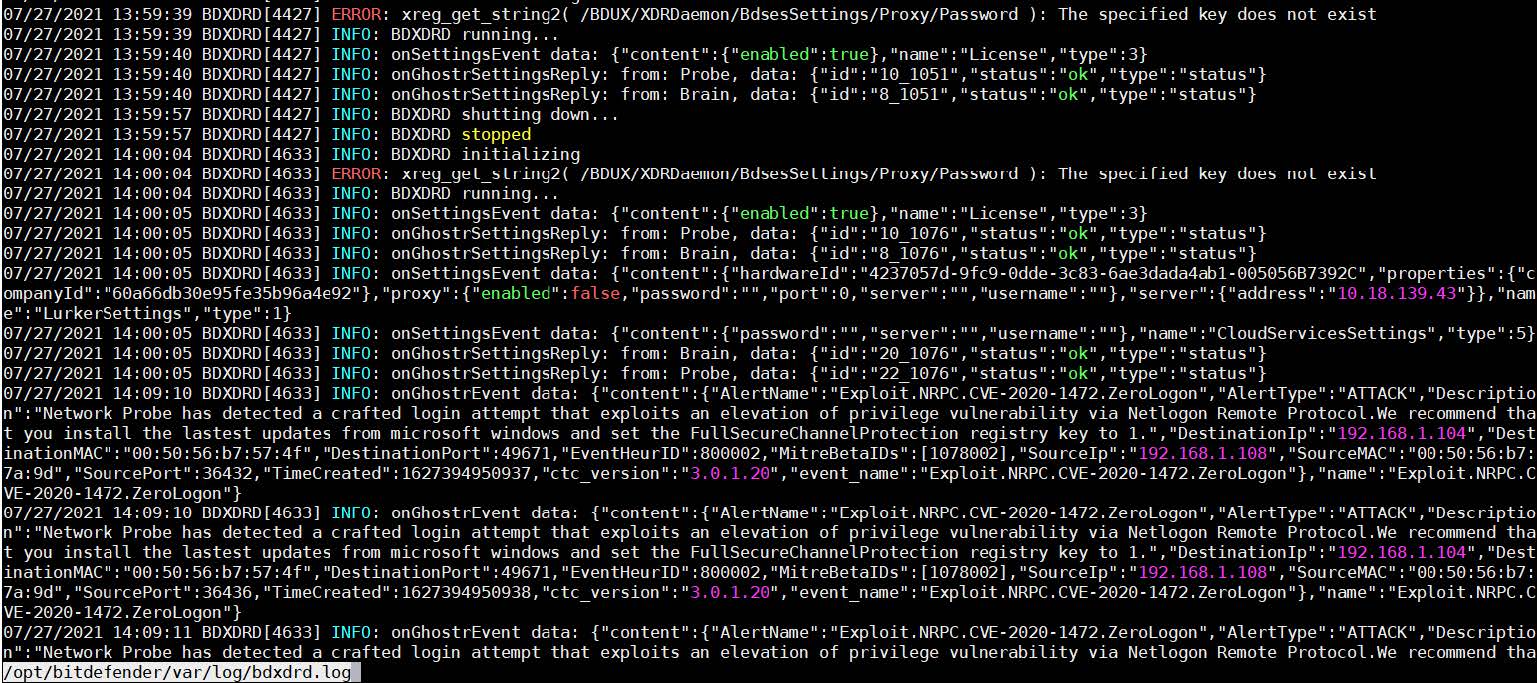
The Network sensor main log file can be found here:
/opt/bitdefender/var/log/bdxdrd.log
View the triggered detections in the Incidents > Search section, by using the following query: alert.type:ghoster.
If you encounter any issues with your Network sensor, you can collect debug logs and contact Bitdefender Enterprise Support for assistance.