Analytics
The Analytics allows you to run reports, pull up data and create various charts and archives.
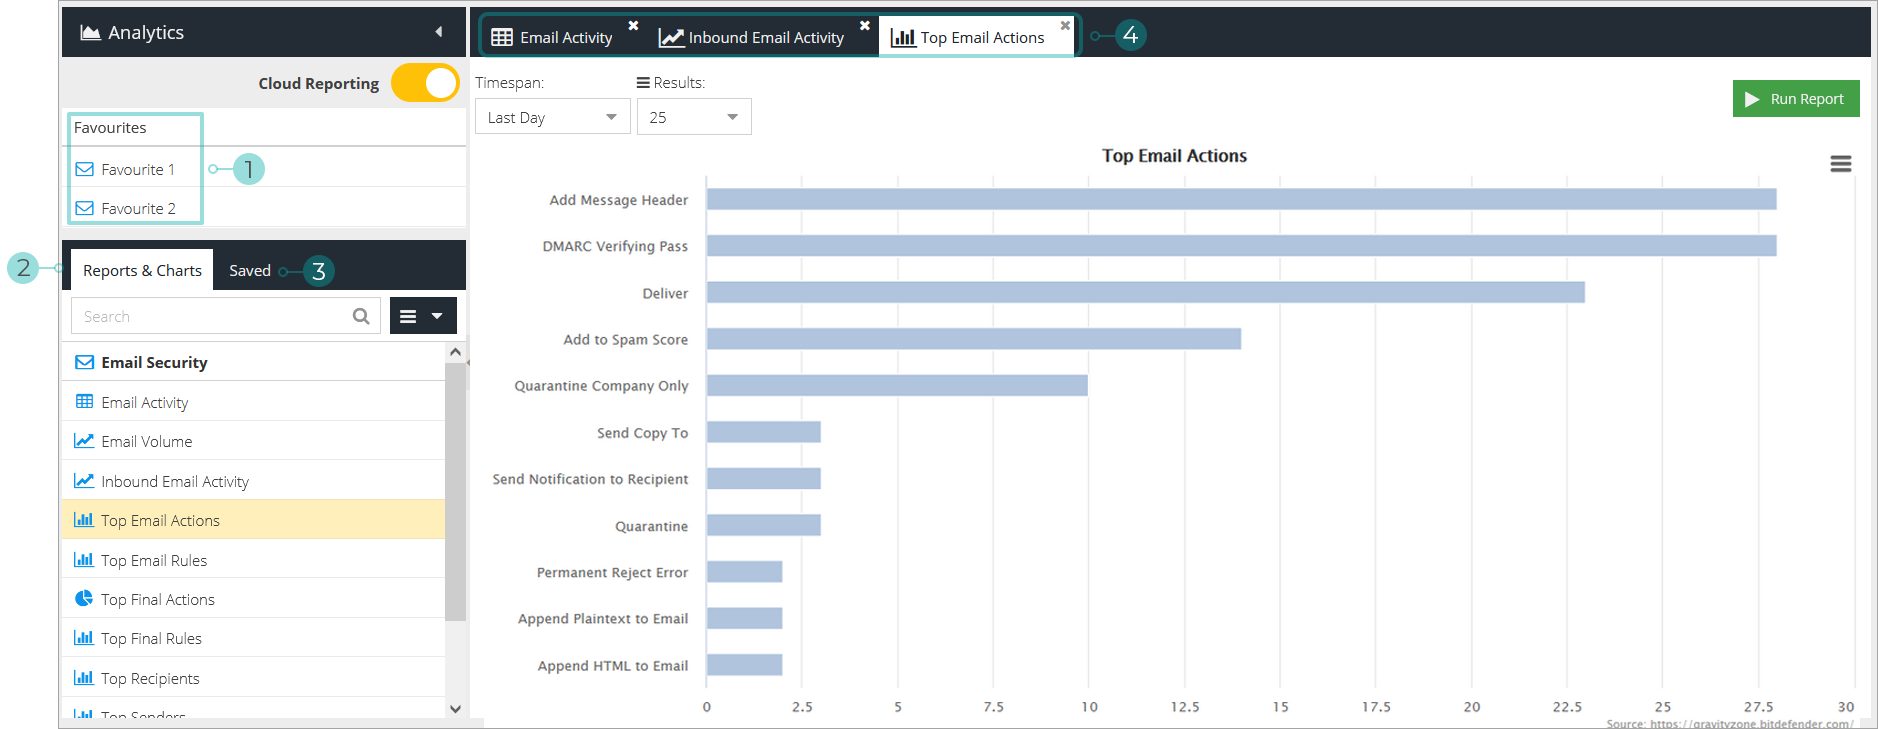
Favourites - displays a list of previously saved reports or charts
Reports & Charts list - shows you a list of available reports and charts. Clicking on one will display it in a new tab on the Active report & charts screen .
Saved - this tab allows you to view a list of saved reports and charts, mark them as favorites, or delete them. licking on one will display it in a new tab on Active report & charts screen .
Active report & charts screen - displays all reports and charts you have opened recently in separate tags. This allows you to toggle through multiple sets of data.
Reports and Charts
Below you can find a list of all available reports and charts
The Email Activity report is shows inbound and outbound e-mail activity processed by GravityZone Security for Email. It tracks and traces e-mail delivery and e-mail rules have been applied to the message during processing.
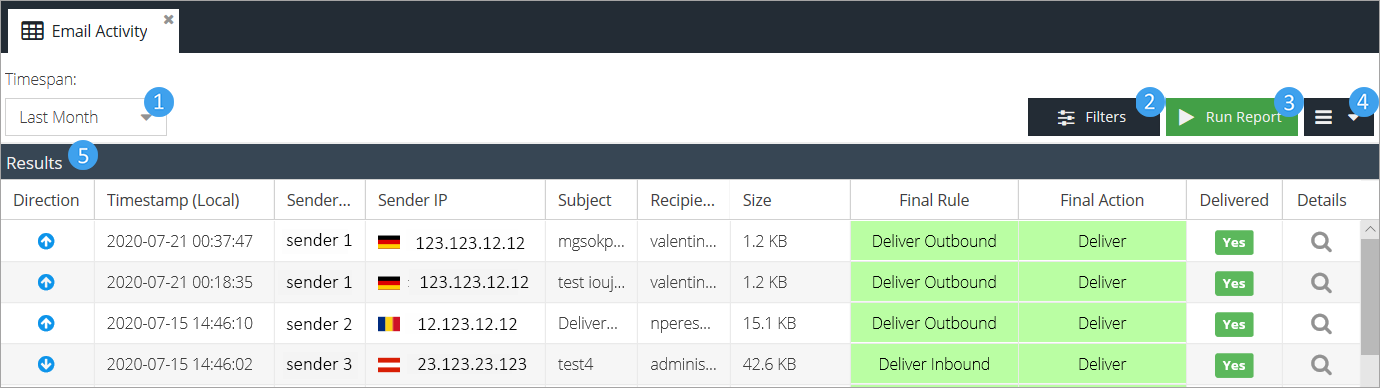
Timespan - select the time period you would like to run the report for.
Filters - add additional conditions to filter out specific results.
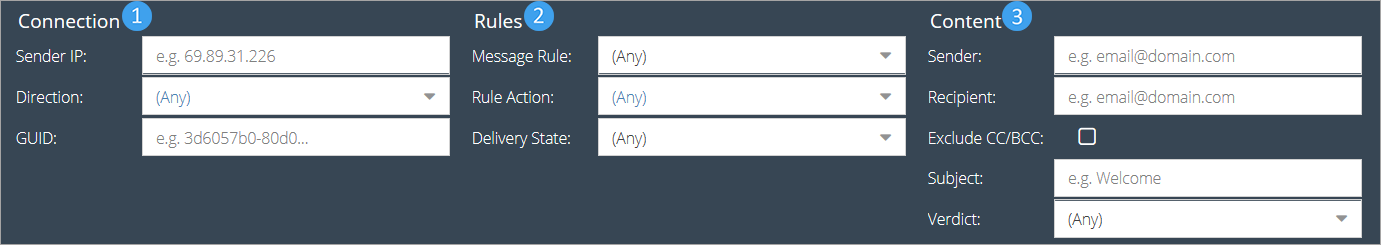
Connection
Sender IP - The IP address of the sender.
Direction - The direction of the email (inbound, outbound or both).
GUIDA - globally unique ID to identify the message (generated by the Email Security system).
Rules
Message Rule - A Message Rule matched conditions and triggered during processing of the email.
Rule Action - the assigned action to the rule that triggered during processing of the email.
Delivery State - The final delivery state of the message (Delayed, Dropped or Delivered).
Content
Sender -part of or the full email address of the sender
Recipient - part of or the full email address of the recipient
Exclude CC/BCC - Toggle including the CC/BCC fields in the search on/off.
Subject - part of or the full subject of the email your are looking for.
Verdict - the status of the email after being processed (e.g. Delivered, Rejected, Quarantined, Spam, Virus)
Run report - runs a report based on the settings and filters you have selected.
Additional options
Download - send a copy of the report results via email
Save - save the settings and filters you have selected for future use
Manage products - go to Products > Product Configuration
Results - displays the results of the report based on the settings and filters you have selected.
Note
To add or remove columns from the report click on any of the column headers and select the desired options from the drop down menu.
The following columns are available in the report:
Direction - the direction of the email (inbound, outbound or both)
Timestamp (UTC) - the UTC timestamp that the Email Security service MTA processed the email, taking into account the product region in use
Timestamp (Local) - the local time of the user running the report. This is calculated using the browser offset and converting Timestamp (UTC)
Sender address - the sender's email address
Sender IP - the IP address of the sender
Subject - the subject of the message
Recipient(s) - the recipients of the message. If the message was addressed to multiple recipients a counter will apear (e.g.
test@testdomain.com +2) next to the initial email address. To view CC and BCC header recipients, double click the message or click the details icon.
icon.Size - the size of the email
Verdict - the status of the message after processing (Delivered, Rejected, Quarantined, Spam, Virus)
Delivery State - the final delivery state of the message(Delayed, Dropped or Delivered)
Final Rule - the rule name that triggered the Final Action during processing.
Final Action - the Final Action that was applied to the message before processing was stopped
Delivered - whether or not the customer email server/service accepted the email for delivery. For full delivery logs, double click the message or click the details icon and then open the Server Log tab.
Verdict Details - Additional meta data that was set during rule processing.
Details - click on the details
icon to display additional information on the emailGeneral - provides general information on the email:
Final Action - the final action taken by the triggered rule
GUID - the unique identifier of the sender email address
Note
Clicking on the GUID will display an Email Activity report based to the ID.
Sender - the sender email address
Sender IP - the sender IP address
Recipient(s) - the intended recipient email address
Subject - the subject line of the email
Extra Details - additional in-depth information
Size - the size of the email
Actions - rules triggered by the message since received, the actions taken and relevant data.
Attachments - attachments that are contained in the email
URLs - URLs or links contained in the email
Headers - email headers
Server log - the email server log
Email Volume shows the number of incoming and outgoing emails over a period of time.
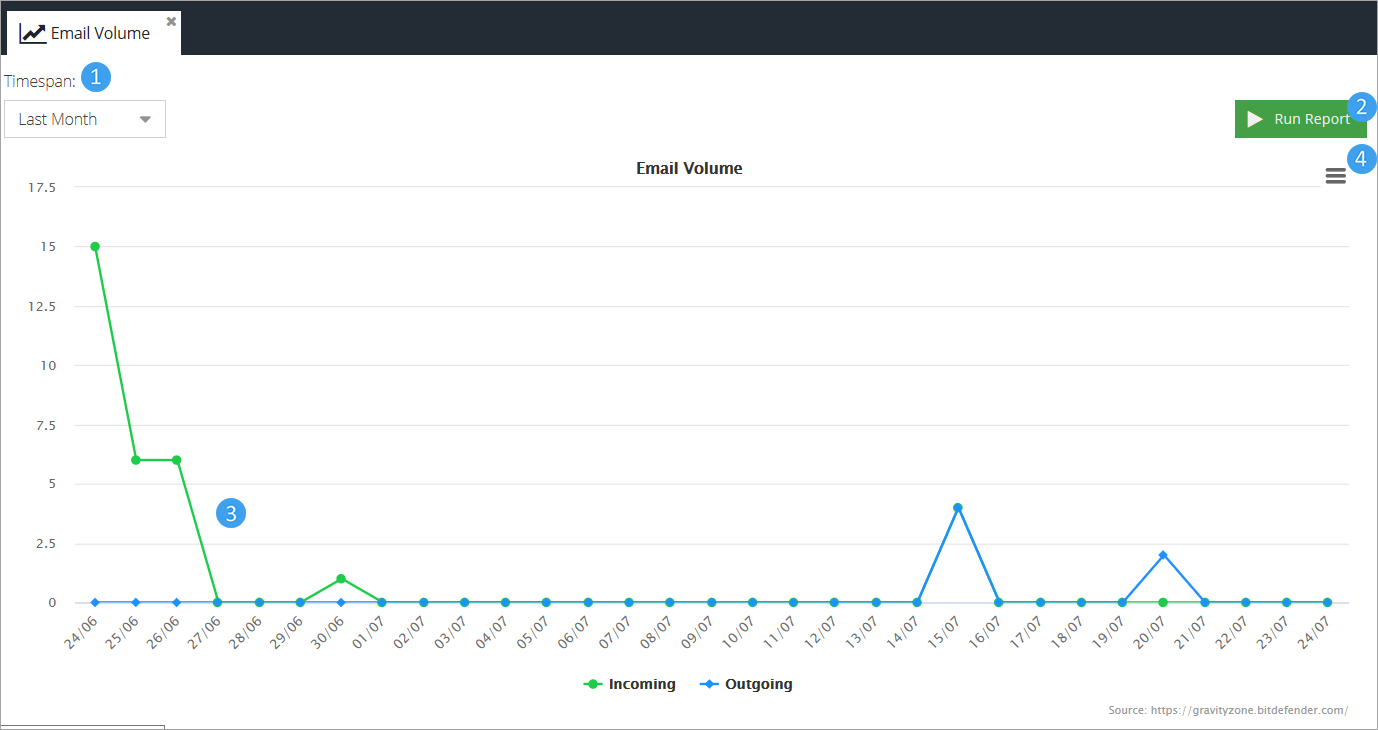
Timespan - select the time period you would like to run the report for.
Run report - runs a report based on the settings and filters you have selected.
Chart - the chart is a comparative graphical representation of inbound and outbound email activity
Chart Context Menu
Print Chart
Download PNG image
Download SVG vector image
Download JPEG image
Download PDF document
Download from server - this sends an email with a PDF version of the chart to a chosen recipient
Save - save the report with the currently selected filters and settings for use at a later date
Save as - can be used when opening an already saved report to save a variation of the original.
Inbound Email Activity shows the number of incoming emails over a period of time.
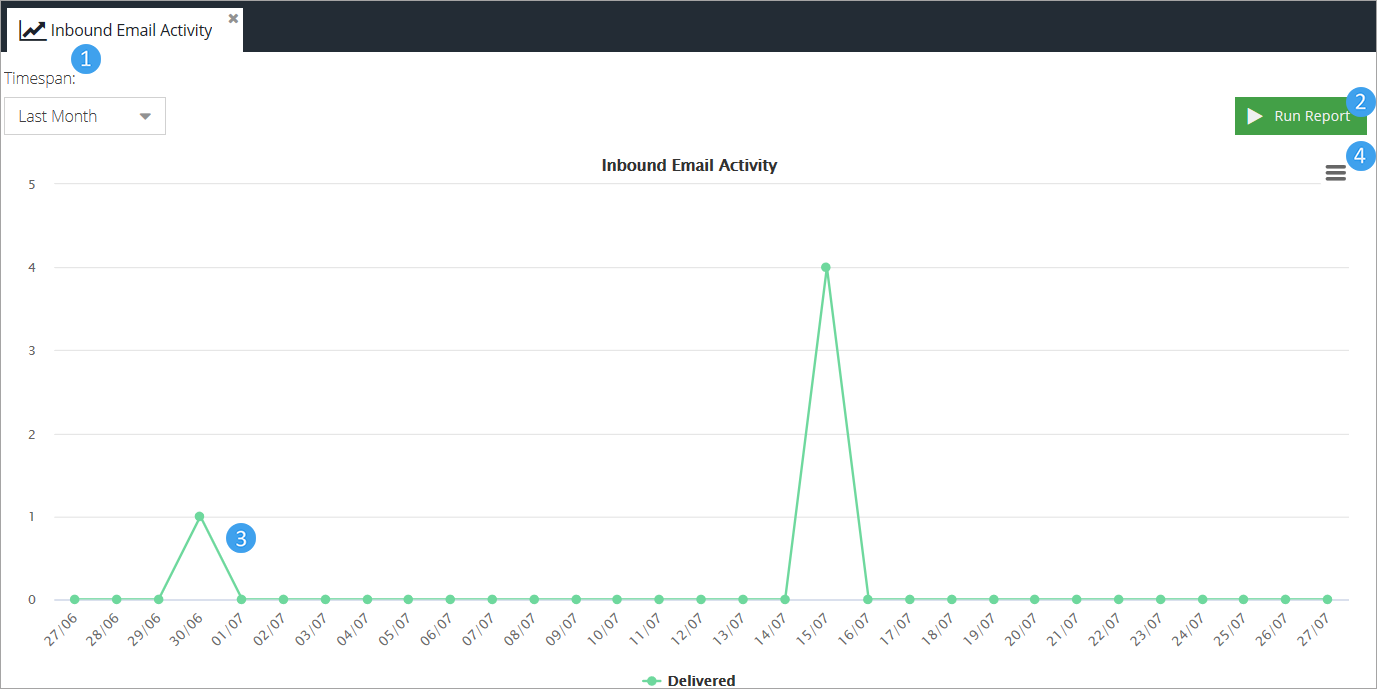
Timespan - select the time period you would like to run the report for.
Run report - runs a report based on the settings and filters you have selected.
Chart - the chart is a comparative graphical representation of inbound and outbound email activity
Chart Context Menu
Print Chart
Download PNG image
Download SVG vector image
Download JPEG image
Download PDF document
Download from server - this sends an email with a PDF version of the chart to a chosen recipient
Save - save the report with the currently selected filters and settings for use at a later date
Save as - can be used when opening an already saved report to save a variation of the original.
This chart shows of the most commonly triggered actions over a specific period of time.
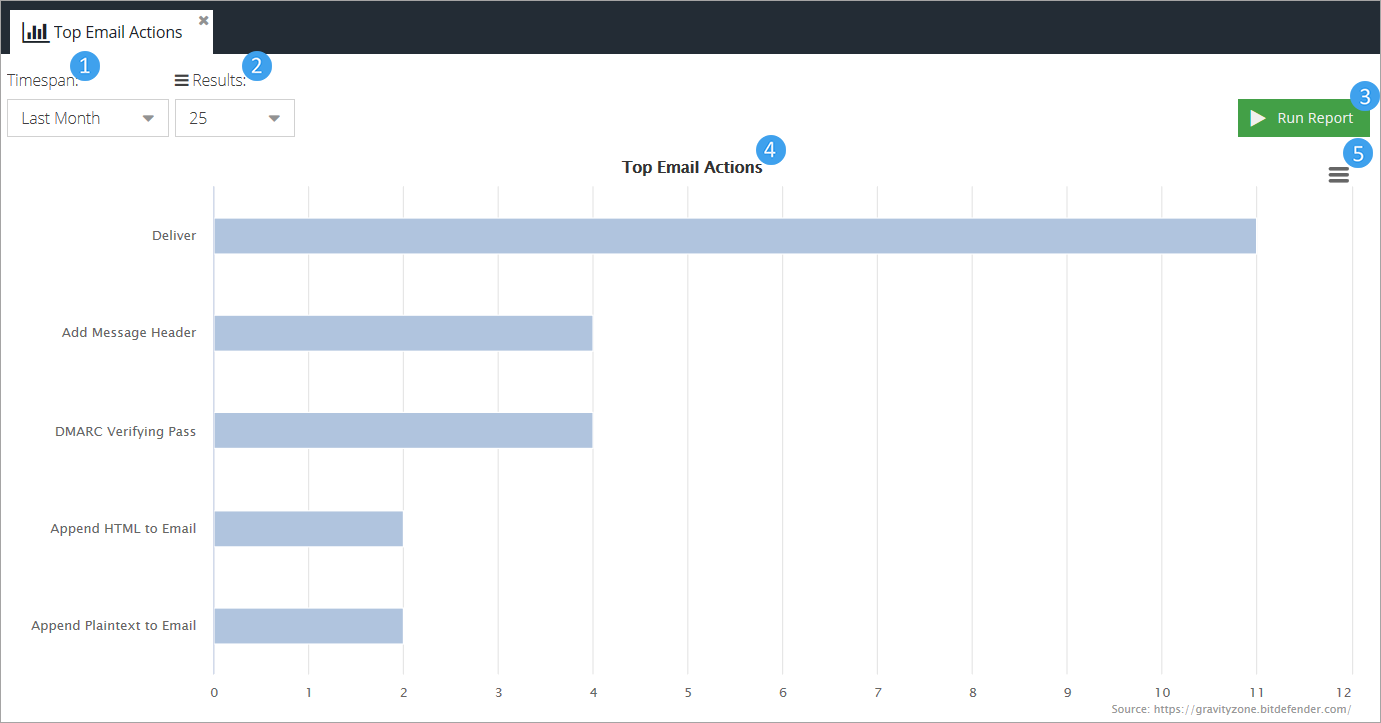
Timespan - select the time period you would like to run the report for.
Results - Change the maximum number of results the chart will reference all values to.
Run report - runs a report based on the settings and filters you have selected.
Chart - shows a comparative graphical representation of the most commonly triggered actions.
Note
Clicking on any of the rows will open a new tab with an email activity report specific to that value.
Chart Context Menu
Print Chart
Download PNG image
Download SVG vector image
Download JPEG image
Download PDF document
Download from server - this sends an email with a PDF version of the chart to a chosen recipient
Save - save the report with the currently selected filters and settings for use at a later date
Save as - can be used when opening an already saved report to save a variation of the original.
This chart shows the most commonly applied rules to messages over a specific period of time.
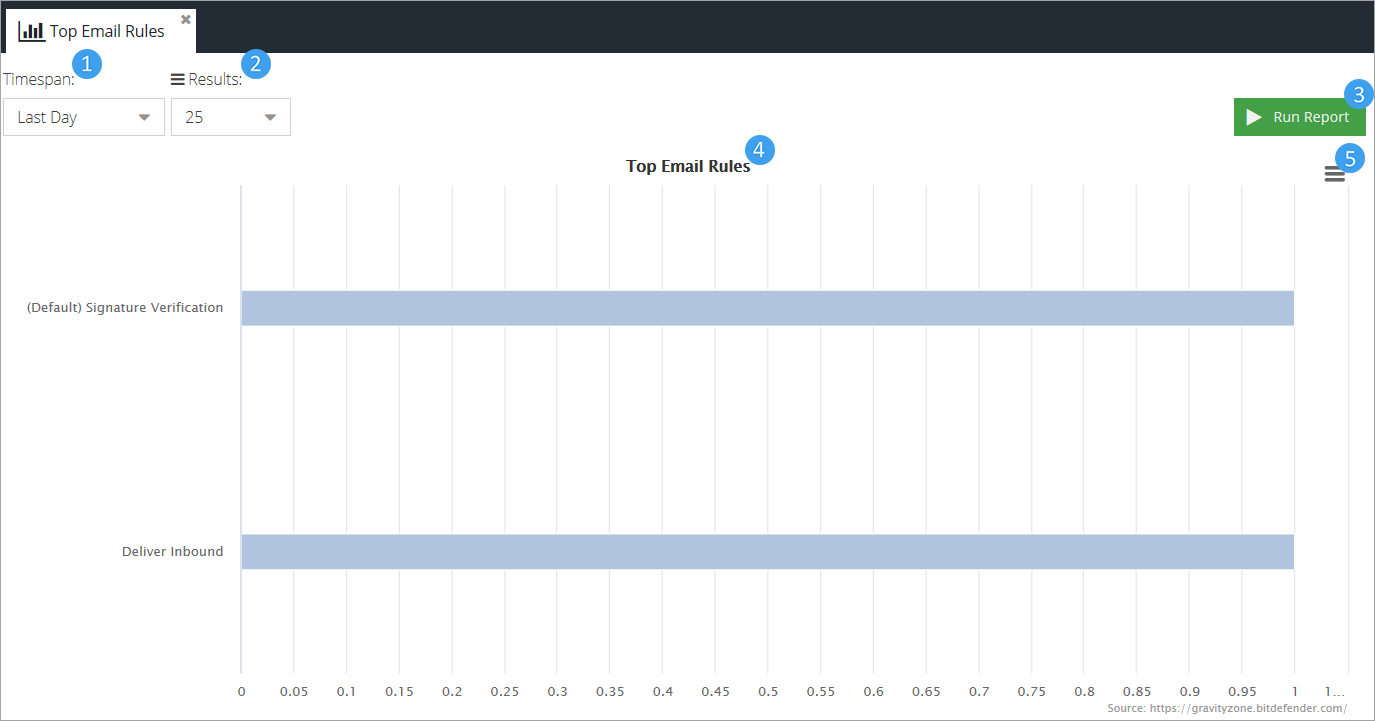
Timespan - Change how far back email activity will be displayed.
Results - Change the maximum number of results the chart will reference all values to.
Run report - runs a report based on the settings and filters you have selected.
Chart - shows a comparative graphical representation of the most commonly applied message rules.
Note
Clicking on any of the rows will open a new tab with an email activity report specific to that value.
Chart Context Menu
Print Chart
Download PNG image
Download SVG vector image
Download JPEG image
Download PDF document
Download from server - this sends an email with a PDF version of the chart to a chosen recipient
Save - save the report with the currently selected filters and settings for use at a later date
Save as - can be used when opening an already saved report to save a variation of the original.
This chart shows the most commonly triggered final actions over a specific period of time.
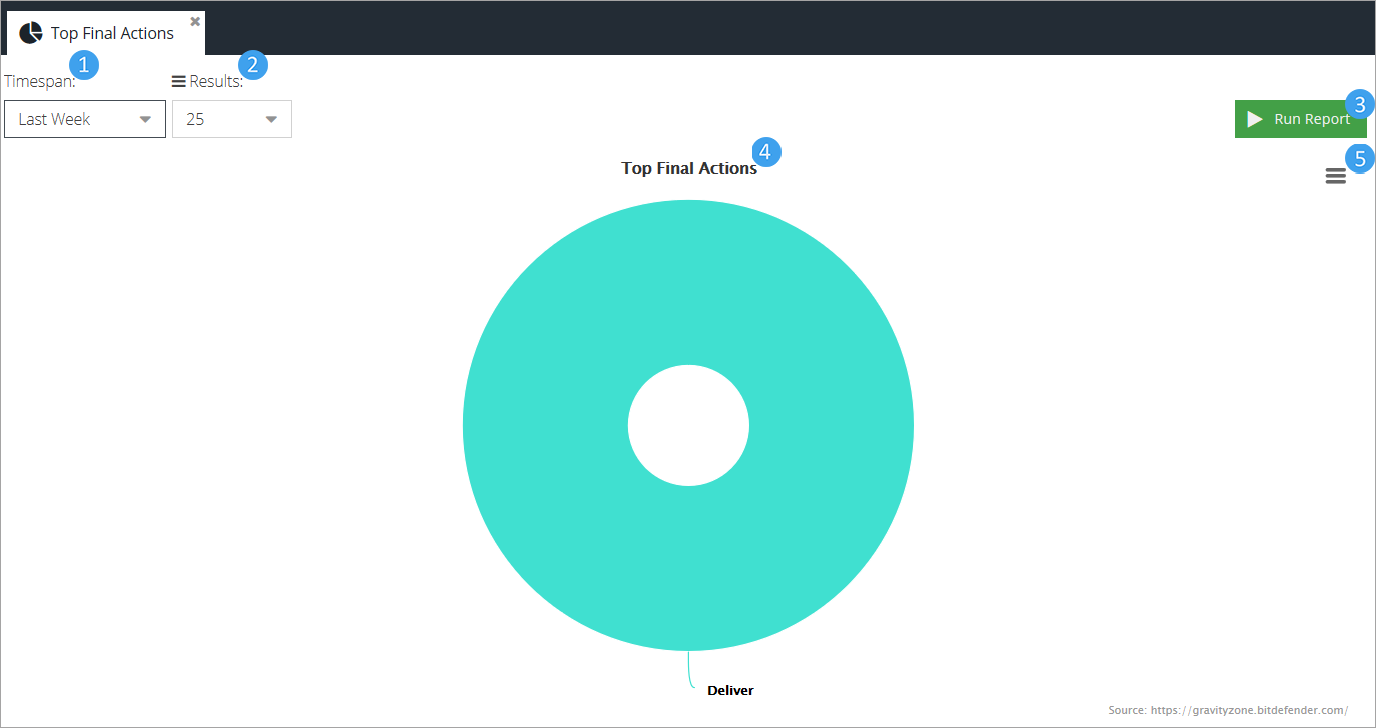
Timespan - Change how far back email activity will be displayed.
Results - Change the maximum number of results the chart will reference all values to.
Run report - runs a report based on the settings and filters you have selected.
Chart - shows a comparative graphical representation of the most commonly triggered final actions.
Note
Clicking on any section of the graph will open a new tab with an email activity report specific to that value.
Chart Context Menu
Print Chart
Download PNG image
Download SVG vector image
Download JPEG image
Download PDF document
Download from server - this sends an email with a PDF version of the chart to a chosen recipient
Save - save the report with the currently selected filters and settings for use at a later date
Save as - can be used when opening an already saved report to save a variation of the original.
This chart shows the most commonly applied final rules to messages over a specific period of time.
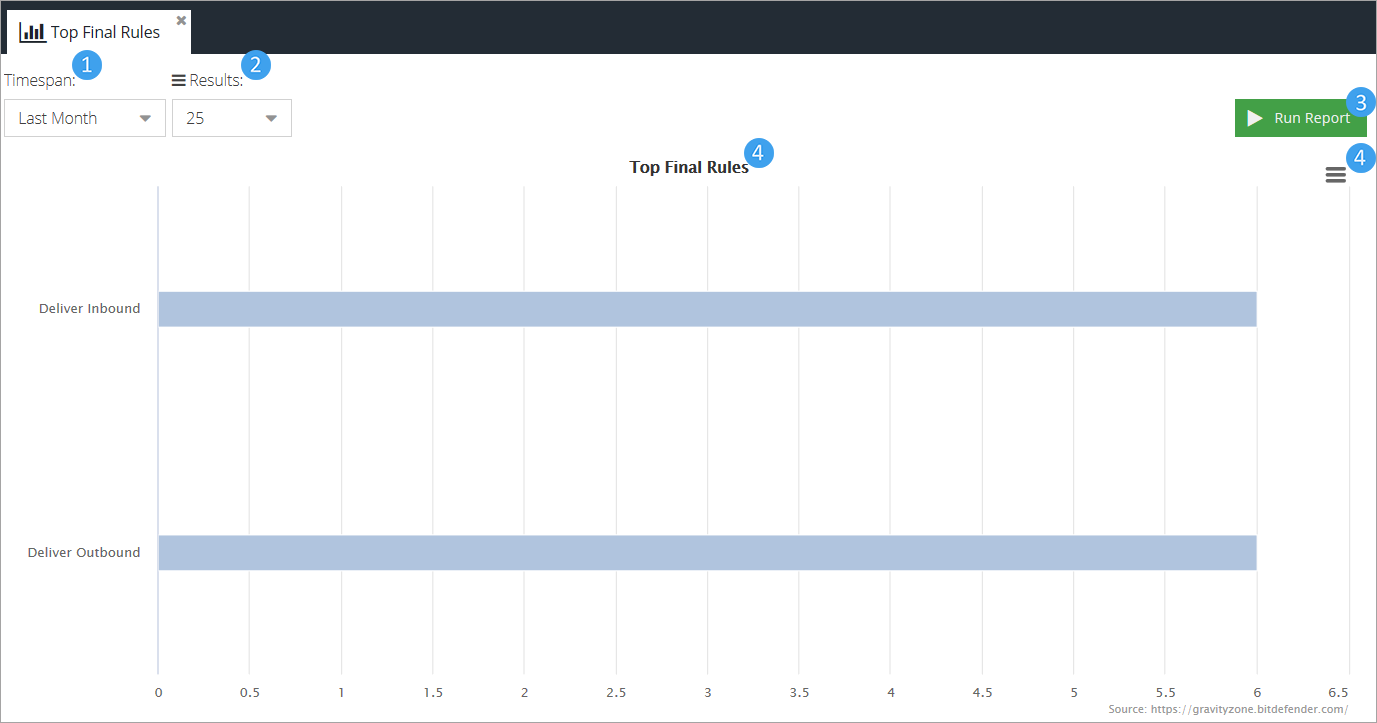
Timespan - Change how far back email activity will be displayed.
Results - Change the maximum number of results the chart will reference all values to.
Run report - runs a report based on the settings and filters you have selected.
Chart - shows a comparative graphical representation of the most commonly applied final rules.
Note
Clicking on any of the rows will open a new tab with an email activity report specific to that value.
Chart Context Menu
Print Chart
Download PNG image
Download SVG vector image
Download JPEG image
Download PDF document
Download from server - this sends an email with a PDF version of the chart to a chosen recipient
Save - save the report with the currently selected filters and settings for use at a later date
Save as - can be used when opening an already saved report to save a variation of the original.
This report shows the users that received the most messages over a specific period of time.
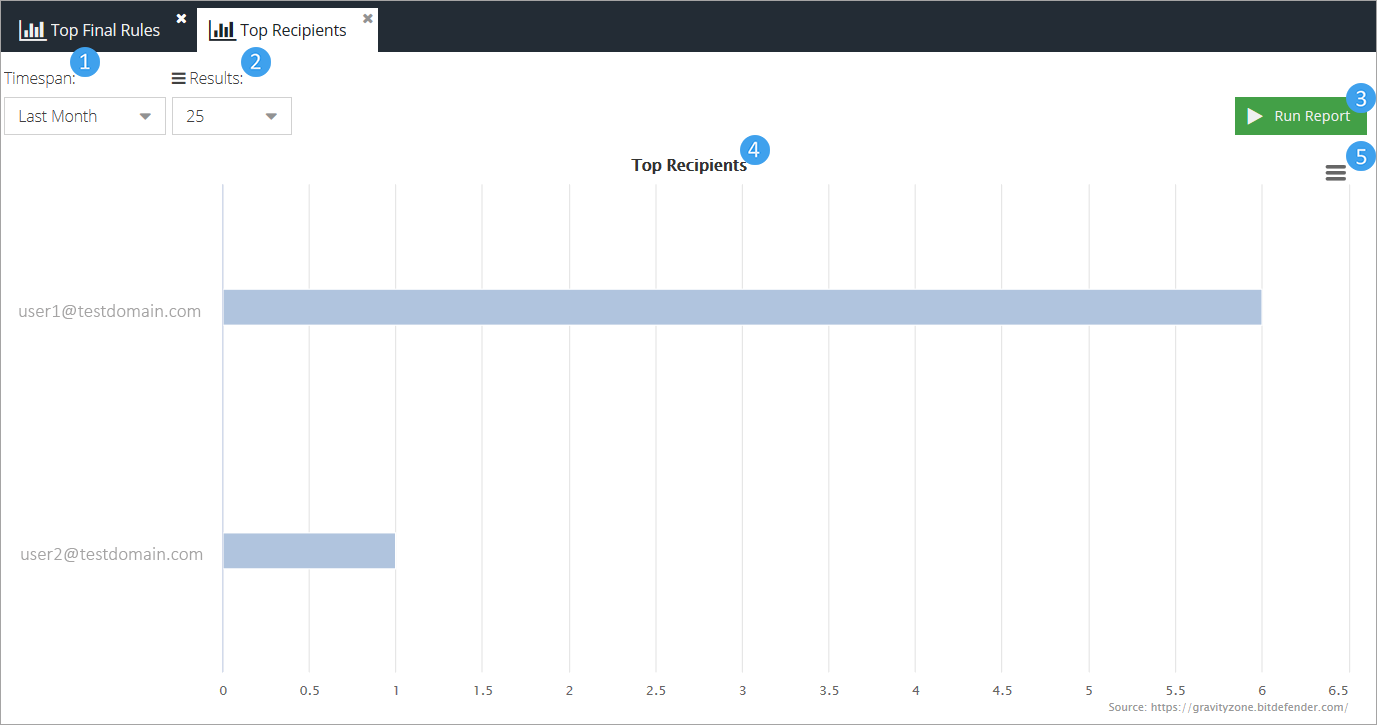
Timespan - Change how far back email activity will be displayed.
Results - Change the maximum number of results the chart will reference all values to.
Run report - runs a report based on the settings and filters you have selected.
Chart - shows a comparative graphical representation of the highest number of messages received per user.
Note
Clicking on any of the rows will open a new tab with an email activity report specific to that value.
Chart Context Menu
Print Chart
Download PNG image
Download SVG vector image
Download JPEG image
Download PDF document
Download from server - this sends an email with a PDF version of the chart to a chosen recipient
Save - save the report with the currently selected filters and settings for use at a later date
Save as - can be used when opening an already saved report to save a variation of the original.
This report shows the users that sent the most messages over a specific period of time.
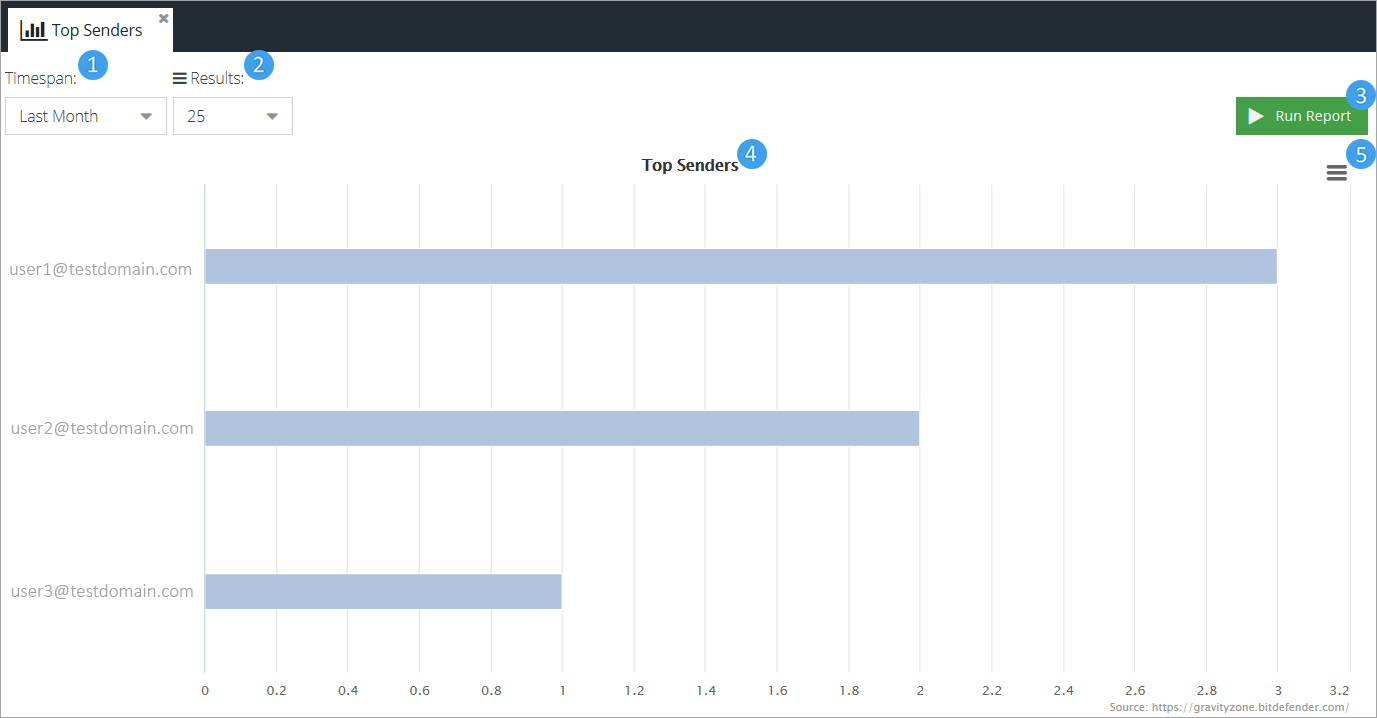
Timespan - Change how far back email activity will be displayed.
Results - Change the maximum number of results the chart will reference all values to.
Run report - runs a report based on the settings and filters you have selected.
Chart - shows a comparative graphical representation of the highest number of messages sent per user.
Note
Clicking on any of the rows will open a new tab with an email activity report specific to that value.
Chart Context Menu
Print Chart
Download PNG image
Download SVG vector image
Download JPEG image
Download PDF document
Download from server - this sends an email with a PDF version of the chart to a chosen recipient
Save - save the report with the currently selected filters and settings for use at a later date
Save as - can be used when opening an already saved report to save a variation of the original.
This report shows the users that received the most messages marked as spam over a specific period of time.
This report shows the users that received the most messages marked as a virus threat over a specific period of time.