Report types
The reports you have access to may vary depending on factors such as:
Company account
User rights
License
These are all the reports currently available in the GravityZone Control Center:
Amazon EC2 Monthly Usage
Informs you about the hourly usage for all managed instances that belong to the companies under your management:
The pie chart displays the hourly usage distribution, per instance type, across all your managed companies.
The table below the chart provides details regarding the company name, month, the total hourly usage for each company and the number of managed instances for each company.
Clicking the hourly usage number for a company opens a new window that displays detailed usage information for each managed instance that belongs to the company (instance name, instance type, integration name, AWS account ID, IP, hourly usage, and parent company).
Amazon EC2 Subscription Status
Informs you about the status of your Amazon EC2 subscriptions or for the companies under your management:
Partners can Suspend or Reactivate integrations directly from the Amazon EC2 Subscription Status report.
Clicking an integration subscription status opens a new window that displays the subscription status history.
Important
If the subscription credentials are invalid, the Integration Status field will display Failed as its value.
Antiphishing Activity
Informs you about the activity of the Antiphishing module of Bitdefender Endpoint Security Tools. You can view the number of blocked phishing websites on the selected endpoints and the user that was logged in at the time of the last detection. By clicking the links from the Blocked Websites column, you can also view the website URLs, the number of block occurrences, and the date of the last event.
The report also includes a classification of the detection events and affected endpoints as follows:
Top 10 domains blocked on endpoints details the most frequently detected domains. This information is only available in PDF format.
Top 10 affected endpoints informs you about the endpoints that have the most Antiphishing detections. This information is only available in PDF format.
Affected endpoints presents the total number of endpoints with at least one detection.
Total detections provides the total number of phishing detections on all endpoints.
Blocked Applications
Informs you about the activity of the following modules:
Antimalware
Firewall
Content Control
ATC/IDS
Blocklist
Advanced Anti-Exploit
Anti-tampering
You can view the number of blocked applications on the selected endpoints and the user that was logged in at the time of the last detection.
Clicking the number associated with a target provides additional information on the blocked applications. Such information includes the number of events that occurred, and the date and time of the last Block event.
In this report, you can quickly instruct the protection modules to allow the selected application to run on the target endpoint:
Click the Add Exclusion button to define exceptions in the following modules:
Antimalware
ATC
Content Control
Firewall
A confirmation window will show up, informing you of the new rule that will modify the existing policy for that specific endpoint.
Detected Websites
Informs you about the activity of the Web Control module of Bitdefender Endpoint Security Tools. For each target, you can view the number of blocked, warned, or reported websites. By clicking this number, you can view additional information, such as:
Website URL and category
Number of access attempts per website
Date and time of the last attempt, as well as the user that was logged in at the time of the detection.
Reason for blocking, which includes scheduled access, malware detection, category filtering and blacklisting.
Data Protection
Informs you about the activity of the Data Protection module of Bitdefender Endpoint Security Tools. You can view the number of blocked emails and websites on the selected endpoints, as well as the user that was logged in at the time of the last detection.
Device Control Activity
Informs you about the events that occurred when monitored devices on the endpoints are accessed. For each target endpoint, you can view the number of allow, block and read-only events. Each event can provide you with additional information when clicking the corresponding numbers:
Logged-in user
Device type and ID
Device vendor and product ID
Date and time of the event.
Endpoint Encryption Status
Informs you about the encryption status of the endpoints. The pie chart displays the number of endpoints that are compliant or non-compliant with the encryption policy settings.
The table below the pie chart delivers details such as:
Endpoint name
Fully Qualified Domain Name (FQDN)
Endpoint IP
Operating system
Device policy compliance:
Compliant – when the volumes are all encrypted or unencrypted according to the policy.
Non-compliant – when the status of the volumes is inconsistent with the assigned policy. For example, only one of two volumes is encrypted or an encryption process is in progress on that volume.
Volumes summary
Click the numbers in the Volumes Summary column to view information about each volume of the endpoint: ID, name, encryption status (Encrypted or Unencrypted), issues, type (Boot or Non-boot), size, recovery key ID.
Device policy (Encrypt or Decrypt)
Company name
Endpoint Modules Status
Offers an overview of module coverage for selected targets. In the report details, for each target endpoint, you can view which modules are active, disabled or not installed, and also the scanning engine in use. Clicking the endpoint name will display the Information window with details about the endpoint and installed protection layers.
You can start a task to change the settings of one or several selected endpoints by clicking the Reconfigure agent button, located above the grid. For details, refer to Reconfigure agent.
Endpoint Protection Status
Provides you with various status information concerning the selected endpoints from your network:
Endpoint name
Endpoint IP
Container host
Bitdefender Endpoint Security Tools update status
Last update
Antimalware protection status
Management status
Network activity status (online/offline)
You can apply various filters by to find the information you are looking for.
Executive Summary
The report presents the Executive Summary widgets along with the available data for the selected interval and company. You can also view important information about the network inventory and detection events such as:
Threats details
Provides the detection events available on the Executive Summary page. You can find details about the category of the detected item, threat type and name, action taken, the module that generated the detection, and many others.
Inventory details
Includes details such as endpoint name and type, the corresponding IP address, operating system and assigned policy.
Note
The report does not include events from the Policy rule-based detections widget.
Firewall Activity
Informs you about the activity of the Firewall module of Bitdefender Endpoint Security Tools. You can view the number of blocked traffic attempts and blocked port scans on the selected endpoints, as well as the user that was logged in at the time of the last detection.
HyperDetect Activity
Informs you about the activity of the HyperDetect module of Bitdefender Endpoint Security Tools.
The chart in the upper side of the report page shows you the dynamics of the attack attempts over the specified period of time and their distribution by type of attack.
You can interact with the chart in the following ways:
Hovering over the legend entries will highlight the associated attack type in the chart.
Clicking the entry will show or hide the respective line in the chart.
Clicking any point on a line will filter your table data according to the selected type. For example, if you click any point on the orange line, the table will display only exploits.
The details in the lower part of the report help you identify the malicious attempts in your network and if they were addressed. They refer to:
The path to the malicious file
For fileless attacks, the file path provides the name of the executable used in the attack. Clicking the file path link opens a details window that displays the detection reason and the malicious command line.
The endpoint on which the detection occurred
The protection module that detected the threat
As HyperDetect is an additional layer of the Antimalware and Content Control modules, the report will provide information about one of these two modules, depending on the type of detection.
The type of the intended attack (targeted attack, grayware, exploits, ransomware, suspicious network traffic and files)
The threat status
The module protection level set when the threat was detected (permissive, normal, or aggressive)
Number of times the threat was detected
Most recent detection
Identification as a fileless attack (yes or no), to quickly filter the fileless attack detections
The exact name of the detected threat
The file hash
Note
A file may be used in multiple types of attacks. Therefore, GravityZone reports it for each type of attack it was involved in.
From this report, you can quickly resolve false positives, by adding exceptions in the assigned security policies. To do so, follow these steps:
Select as many entries in the table as you need.
Note
Fileless attack detections cannot be added to the exceptions list, because the detected executable is not malware itself, but can be a threat when using a malicious encoded command line.
Click the Add exception button at the upper side of the table.
In the configuration window, select the policies to which the exception should be added and then click Add.
By default, related information for each added exception is sent to Bitdefender Labs, improving the detection capabilities of Bitdefender products. You can control whether to submit this information using the Submit this feedback to Bitdefender for a better analysis checkbox.
If the threat was detected by the Antimalware module, the exception will apply to both On-access and On-demand scanning modes.
Note
You can find these exceptions in the following sections of the selected policies: Antimalware > Settings for files, and Network Protection > Traffic for URLs.
Integrity Monitoring Activity
Shows you all the events registered from the endpoints you manage, based on the rules you have applied in the policy.
The Integrity Monitoring Activity page consists of a grid that lists the following:
Event date: shows the date of the event
Endpoint name: the name of the endpoint where the event occurred
Company name: the name of the company that registered the event
Reason: the rule that was applied to trigger the event
Category: the category of the event
Change: the change that was made during the event
Severity: the severity type
Type: the type of the event
Location: the location where the event occurred
User: the user under which the event was triggered
Attribute change: the attributes that were changed for this event
The Event details window is available on the right side of the page once you have selected an event. Here, you can view what changes have been made that triggered that event.
This report also displays the number of affected endpoints and the total number of events that have been triggered in the reporting interval.
Integrity Monitoring Configuration Changes
Shows you all the events registered from the endpoints you manage, based on the rules you have applied in the policy, but focusing on the category of the events.
The Integrity Monitoring Configuration Changes page contains the same information as the Integrity Monitoring Activity page, but allows you to change the category for certain events.
To change the category of the events, follow these steps:
Select the events you want to change the category for.
Select their new status from the Change Category dropdown list.
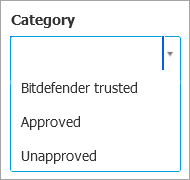
Note
Bitdefender trusted events cannot be changed.
Malware Status
Helps you find out how many and which of the selected endpoints have had contact with malware (be that a prevented attack or situations that needed user intervention) over a specific time period and how the threats have been dealt with. You can also see the user that was logged in at the time of the last detection.
Endpoints are grouped based on these criteria:
Endpoints with no detections (no malware threat has been detected over the specified time period).
Endpoints with resolved malware (all detected files have been successfully disinfected or moved to quarantine).
Endpoints with unresolved malware (some of the detected files have been denied access to).
You can view the list of threats and paths to the affected files, for each endpoint, by clicking the links available in the disinfection result columns.
In this report, you can quickly run a Full Scan task on the unresolved targets, by clicking the Scan infected targets button from the Action Toolbar above the data table.
Bitdefender MDR Service Status
Provides a high-level overview of Bitdefender MDR protection coverage for all your managed companies and their networks.
The report includes a list of all your managed companies, licensing information, Bitdefender MDR service and onboarding status, and network coverage.
You can view additional information on the displayed managed companies by clicking on the names in the Company Name column.
Monthly License Usage
Provides detailed information about the license usage in each month, over a specified time period and for the selected companies that use monthly subscription. The Monthly License Usage report is available for the following product types:
Endpoint Security
Bitdefender EDR
Bitdefender PHASR
In the report, click the plus sign in front of the company name to view the hierarchy of a child company. If needed, you can easily adjust license details by clicking the company name.
Click the numbers in each column to view additional information on the licensed endpoints that use the available GravityZone services.
If Central Scan is enabled, you receive additional information about:
OS type (workstation or server).
Endpoint type (physical or virtual).
Uptime (in seconds) – how much time the endpoint has been protected. Sleep and hibernation modes are not taken into account.
Whether Central Scan (with Security Server) has been used at least once during the past month.
Network Incidents
Informs you about the activity of the Network Attack Defense module. A graph displays the number of the attack attempts detected over a specified interval. The report details include:
Endpoint name, IP and FQDN
Username
Detection name
Attack technique
Number of attempts
Attacker’s IP
Targeted IP and port
When the attack was blocked most recently
Clicking the Add exceptions button for a selected detection automatically creates an entry in Global Exclusions from the Network Protection section.
Network Patch Status
Check the update status of the software that is installed in your network. The report reveals the following details:
Target machine (endpoint name, IP and operating system).
Security patches (installed patches, failed patches, missing security and non-security patches).
Information related to manually approved patches.
Status and last modified time for checked-out endpoints.
Network Protection Status
Provides detailed information on the overall security status of the target endpoints. For example, you can view information about:
Available protection layers
Managed and unmanaged endpoints
License type and status (additional license related columns are hidden by default)
Infection status
Update status of the product and security content
Users who logged into the computer
For unmanaged endpoints, you can view the Unmanaged status under other columns.
On-demand Scanning
Provides information regarding on-demand scans performed on the selected targets. A pie chart displays the statistics of successful and failed scans. The table below the chart provides details regarding the scan type, occurrence and last successful scan for each endpoint.
Policy Compliance
Provides information regarding the security policies applied on the selected targets. A pie chart displays the status of the policy. In the table below the chart, you can view the assigned policy on each endpoint and the policy type, as well as the date and the user that assigned it.
Sandbox Analyzer Failed Submissions
Displays all failed submissions of objects sent from the endpoints to Sandbox Analyzer over a specified time period. A submission is considered failed after several retry attempts.
The graphic shows the variation of the failed submissions during the selected period, while in the report details table you can view which files could not be sent to Sandbox Analyzer, the endpoint where the object was sent from, date and time for each retry, the error code returned, description of each failed retry and the company name.
Sandbox Analyzer Results
Provides you with detailed information related to the files on target endpoints, which were analyzed in the sandbox over a specified time period. A line chart displays the number of the clean or dangerous analyzed files, while the table presents you with details on each case.
You are able generate a Sandbox Analyzer Results report for all analyzed files or only for those detected as malicious.
You can view:
Analysis verdict, saying whether the file is clean, dangerous or unknown (Threat detected / No threat detected / Unsupported). This column shows up only when you select the report to display all analyzed objects.
To view the complete list with file types and extensions supported by Sandbox Analyzer, refer to Supported File Types and Extensions for Manual Submission .
Threat type, such as adware, rootkit, downloader, exploit, host-modifier, malicious tools, password stealer, ramsomware, spam, or Trojan.
Date and time of the detection, which you can filter depending on the reporting period.
Hostname or IP of the endpoint where the file was detected.
Name of the files, if they were submitted individually, or number of analyzed files in case of a bundle. Click the file name or bundle link to view details and actions taken.
Remediation action status for the submitted files (Partial, Failed, Reported Only, Successful).
Company name.
More information about the properties of the analyzed file is available by clicking the
 Read more button in the Analysis Result column. Here you can view security insights and detailed reporting on the sample behavior.
Sandbox Analyzer captures the following behavioral events:
Writing / deleting / moving / duplicating / replacing files on the system and on removable drives.
Execution of newly-created files.
Changes to the file system.
Changes to the applications running inside the virtual machine.
Changes to the Windows taskbar and Start menu.
Creating / terminating / injecting processes.
Writing / deleting registry keys.
Creating mutex objects.
Creating / starting / stopping / modifying / querying / deleting services.
Changing browser security settings.
Changing Windows Explorer display settings.
Adding files to firewall exception list.
Changing network settings.
Enabling execution at system startup.
Connecting to a remote host.
Accessing certain domains.
Transferring data to and from certain domains.
Accessing URLs, IPs and ports through various communication protocols.
Checking the indicators of virtual environment.
Checking the indicators of monitoring tools.
Creating snapshots.
SSDT, IDT, IRP hooks.
Memory dumps for suspicious processes.
Windows API functions calls.
Becoming inactive for a certain time period to delay execution.
Creating files with actions to be executed at certain time intervals.
In the Analysis Result window, click the Download button to save to your computer the Behavior Summary content in the following formats: XML, HTML, JSON, PDF.
Alternatively, you can use submission cards to gather the necessary information on analyzed samples. The submission cards are available in the Sandbox Analyzer section, in the main menu of Control Center.
Security Audit
Provides information about the security events that occurred on a selected target. The information refers to the following events:
Malware detection
UEFI object
AMSI detection
Blocked application
Reported application
Remediated application
Blocked scan port
Blocked traffic
Blocked website
Warned website
Warned and disregarded website
Detected website
Reported website
Blocked device
Allowed device
Read-only device
Blocked email
Blocked process
Exploit - ROP
Exploit - Flash
Exploit - Shellcode
Exploit - Process creation
Exploit - System
Exploit - Process introspection
Exploit - VB script
Exploit - Others
Network incident
Blocked remote attack
Reported remote attack
Callback evasion detection
Vulnerable drivers detection
Blocked DLL
Blocked script
To simplify the analysis of Antimalware detections, the report classifies them along with the affected endpoints based on different criteria as follows:
Top 10 malware by number of endpoints, details the most frequent Antimalware detections (available only in PDF format).
Top 10 endpoints by number of Antimalware detections, which informs you about the endpoints that have the most Antimalware detection (available only in PDF format).
Endpoints, which presents the total number of endpoints with at least one Antimalware detection.
Detections, which provides the total number of Antimalware detections on all endpoints.
Security Container Status
Helps you evaluate the status of the target Security Container. You can identify the issues each Security Server might have, with the help of various status indicators, such as:
Security Container Name: the name of the container
IP: the IP address of the container
Container Host: displays the host managing this specific container
Status: shows the overall container status
Last Security Content Update: date at which the container was last updated
Security Content Update Status: shows if the security content is up to date or whether the updates have been disabled.
Product Update Status: shows if the product version is up to date or whether the updates have been disabled.
Current Product Version: product version currently installed on the container.
Last Product Update: date at which the Security Container was deployed.
Note
To update a Security Container you need to redeploy it with the new product version.
Latest Product Version: latest product version available.
Security Server Status
Helps you evaluate the status of the target Security Servers. You can identify the issues each Security Server might have, with the help of various status indicators, such as:
Status: shows the overall Security Server status.
Machine status: informs which Security Server appliances are stopped.
AV status: points out whether the Antimalware module is enabled or disabled.
Update status: shows if the Security Server appliances are updated or whether the updates have been disabled.
Load status: indicates the scan load level of a Security Server as described here:
Underloaded, when less than 5% of its scanning capacity is used.
Normal, when the scan load is balanced.
Overloaded, when the scan load exceeds 90% of its capacity. In such case, check the security policies. If all Security Servers allocated within a policy are overloaded, you need to add another Security Server to the list. Otherwise, check the network connection between the clients and Security Servers without load issues.
You can also view how many agents are connected to the Security Server. Further on, clicking the number of connected clients will display the list of endpoints. These endpoints may be vulnerable if the Security Server has issues.
Top 10 Detected Malware
Shows you the top 10 malware threats detected over a specific time period on selected endpoints.
Note
The details table displays all endpoints which were infected by the top 10 detected malware.
Top 10 Infected Endpoints
Shows you the top 10 most infected endpoints by the number of total detections over a specific time period out of the selected endpoints.
Note
The details table displays all malware detected on the top 10 infected endpoints.
Update Status
Using the available filters, you can easily find out which clients have updated and which have not in the last 24 hours.
In this report, you can quickly bring the agents to the latest version. To do this, click the Update button from the Action Toolbar above the data table.
Upgrade Status
Shows you the security agents installed on the selected targets and whether a more recent solution is available.
For endpoints with old security agents installed, you can quickly install the latest supported security agent by clicking the Upgrade button. This operation is possible only if all targets are from the same company.
Note
This report is available only when a GravityZone solution upgrade has been made.
Ransomware Activity
Informs you with regards to the ransomware attacks that GravityZone detected on the endpoints you manage, and provides you with the necessary tools to recover the files affected during the attacks.
The report is available as a page in Control Center, distinct from the other reports, accessible right from the Control Center main menu.
The Ransomware Activity page consists of a grid that, for each ransomware attack, lists the following:
The name, IP address and FQDN of the endpoint on which the attack took place
The company to which the endpoint belongs
The name of the user who was logged in during the attack
The type of attack, respectively a local or a remote one
The process under which the ransomware ran for local attacks, or the IP address from which the attack was initiated for remote ones
Date and time of the detection
Number of files encrypted until the attack was blocked
The restore action status for all files on the target endpoint
Some details are hidden by default. Click the Show/Hide Columns button in the upper right side of the page to configure the details you want to view in the grid. If you have many entries in the grid, you can choose to hide filters using the Show/Hide filters button in the upper right side of the page.
Additional information is available by clicking the number for files. You can view a list with the full path to the original and restored files, and the restore status for all files involved in the selected ransomware attack.
Important
The backup copies are available for maximum 30 days. Please mind the date and time until files may still be recovered.
To recover files from ransomware, follow these steps:
Select the attacks you want in the grid.
Click the Restore files button. A confirmation window shows up.
A recovery task is being created. You can check its status in the Tasks page, just like for any other task in GravityZone.
If detections are the result of legitimate processes, follow these steps:
Select the records in the grid.
Click the Add exclusion button.
In the new window, select the policies to which the exclusion must apply.
Click Add.
GravityZone will apply all possible exclusions: on folder, on process, and on IP address.
You can check or modify them in the Antimalware > Settings > Custom Exclusions policy section.
Note
Ransomware Activity keeps record of events for two years.
[Extended Email Security] Monthly License Usage
This report provides license usage for the Extended Email Security service. All report intervals retrieve license usage information until the end of the previous day.
For example, you generate a report on Monday, at 12:00 PM, and set the interval to This month. The report will provide license usage information by the end of Sunday.
[Exchange] Blocked Content and Attachments
Provides you with information about emails or attachments that Content Control deleted from the selected servers over a specific time interval. The information includes:
Email addresses of the sender and of the recipients.
When the email has more recipients, instead of the email addresses, the report displays the recipients number with a link to a window containing the list of email addresses.
Email subject.
Detection type, indicating which Content Control filter detected the threat.
The action taken on the detection.
The server where the threat was detected.
The company that owns the mail server.
[Exchange] Blocked Unscannable Attachments
Provides you with information about emails containing unscannable attachments (over-compressed, password-protected, etc.), blocked on the selected Exchange mail servers over a specific time period. The information refers to:
Email addresses of the sender and of the recipients.
When the email is sent to more recipients, instead of the email addresses, the report displays the recipients number with a link to a window containing the list of email addresses.
Email subject.
The actions taken to remove the unscannable attachments:
Deleted Email, indicating that the entire email has been removed.
Deleted Attachments, a generic name for all actions that remove attachments from the email message, such as deleting the attachment, moving to quarantine or replacing it with a notice.
By clicking the link in the Action column, you can view details about each blocked attachment and the corresponding action taken.
Detection date and time.
The server where the email was detected.
The company that owns the mail server.
[Exchange] Email Scan Activity
Shows statistics on the actions taken by the Exchange Protection module over a specific time interval.
The actions are grouped by detection type (malware, spam, forbidden attachment and forbidden content) and by server.
The statistics refer to the following email statuses:
Quarantined. These emails were moved to the Quarantine folder.
Deleted/Rejected. These emails were deleted or rejected by the server.
Redirected. These emails were redirected to the email address supplied in the policy.
Cleaned and delivered. These emails had the threats removed and passed through the filters.
An email is considered cleaned when all detected attachments have been disinfected, quarantined, deleted or replaced with text.
Modified and delivered. Scan information was added to the emails headers and the emails passed through the filters.
Delivered without any other action. These emails were ignored by Exchange Protection and passed through the filters.
[Exchange] Malware Activity
Provides you with information about emails with malware threats, detected on the selected Exchange mail servers over a specific time period. The information refers to:
Email addresses of the sender and of the recipients.
When the email is sent to more recipients, instead of the email addresses, the report displays the recipients number with a link to a window containing the list of email addresses.
Email subject.
Email status after antimalware scan.
By clicking the status link, you can view details about the detected malware and the action taken.
Detection date and time.
The server where the threat was detected.
The company that owns the mail server.
[Exchange] Monthly License Usage
Provides detailed information regarding the Security for Exchange license usage for your company over a specific time period.
The table below the graphic provides details regarding the company name, license key, month and number of protected mailboxes belonging to your company.
The license usage number links to a new window, where you can find detailed usage information such as domains licensed on your company and the belonging mailboxes.
[Exchange] Top 10 Detected Malware
Informs you about the top 10 most detected malware threats in email attachments. You can generate two views containing different statistics. One view shows the number of detections by affected recipients and one by senders.
For example, GravityZone has detected one email with an infected attachment sent to five recipients.
In the recipients view:
The report shows five detections.
The report details shows only the recipients, not the senders.
In the senders view:
The report shows one detection.
The report details shows only the sender, not the recipients.
Besides the sender/recipients and the malware name, the report provides you with the following details:
The malware type (virus, spyware, PUA, etc.)
The server where the threat was detected.
Measures that the Antimalware module has taken.
Date and time of the last detection.
[Exchange] Top 10 Malware Recipients
Shows you the top 10 email recipients most targeted by malware over a specific time interval.
The report details provide you with the entire malware list that affected these recipients, together with the actions taken.
[Exchange] Top 10 Spam Recipients
Shows you the top 10 email recipients by the number of spam or phishing emails detected over a specific time interval. The report provides information also on the actions applied to the respective emails.
[Mobile] Monthly License Usage
Provides detailed information regarding the Mobile Security license usage for your company over a specific time period.
The table below the graphic provides details regarding the company name, license key, month and number of protected devices belonging to your company.
The license usage number links to a new window, where you can find detailed usage information such as company name, license keys, device ID, device model, device OS, device user, first seen and last seen.
Data Insights License Usage
Provides detailed information about GravityZone Security Data Lake and Security Data Lake for MDR license usage for your company or managed companies for a specific month.
The table below the graphic shows details such as company name, license key, product name, month, and the following usage metrics, for the selected period:
Total Ingestion Volume Usage (GB): the total amount of ingested data.
Total Ingestion Volume Usage Exceeded (GB): the total amount of ingested data that exceeds the licensed limit.
Data Lake Storage Usage (TB): the total volume of stored data.
Data Lake Storage Usage Exceeded (TB): indicates storage that exceeds the licensed limit.
You can select a company to view a daily usage report, which provides day-by-day details for ingestion and storage usage within the selected month.
Simplified Monthly License Usage
This is a lightweight version of the Monthly License Usage report, providing detailed information about the license usage in each month, over a specified time period and for the selected companies that use monthly subscription.
As opposed to the Monthly License Usage report, it does not contain any specific endpoint related usage information.