Executive Summary
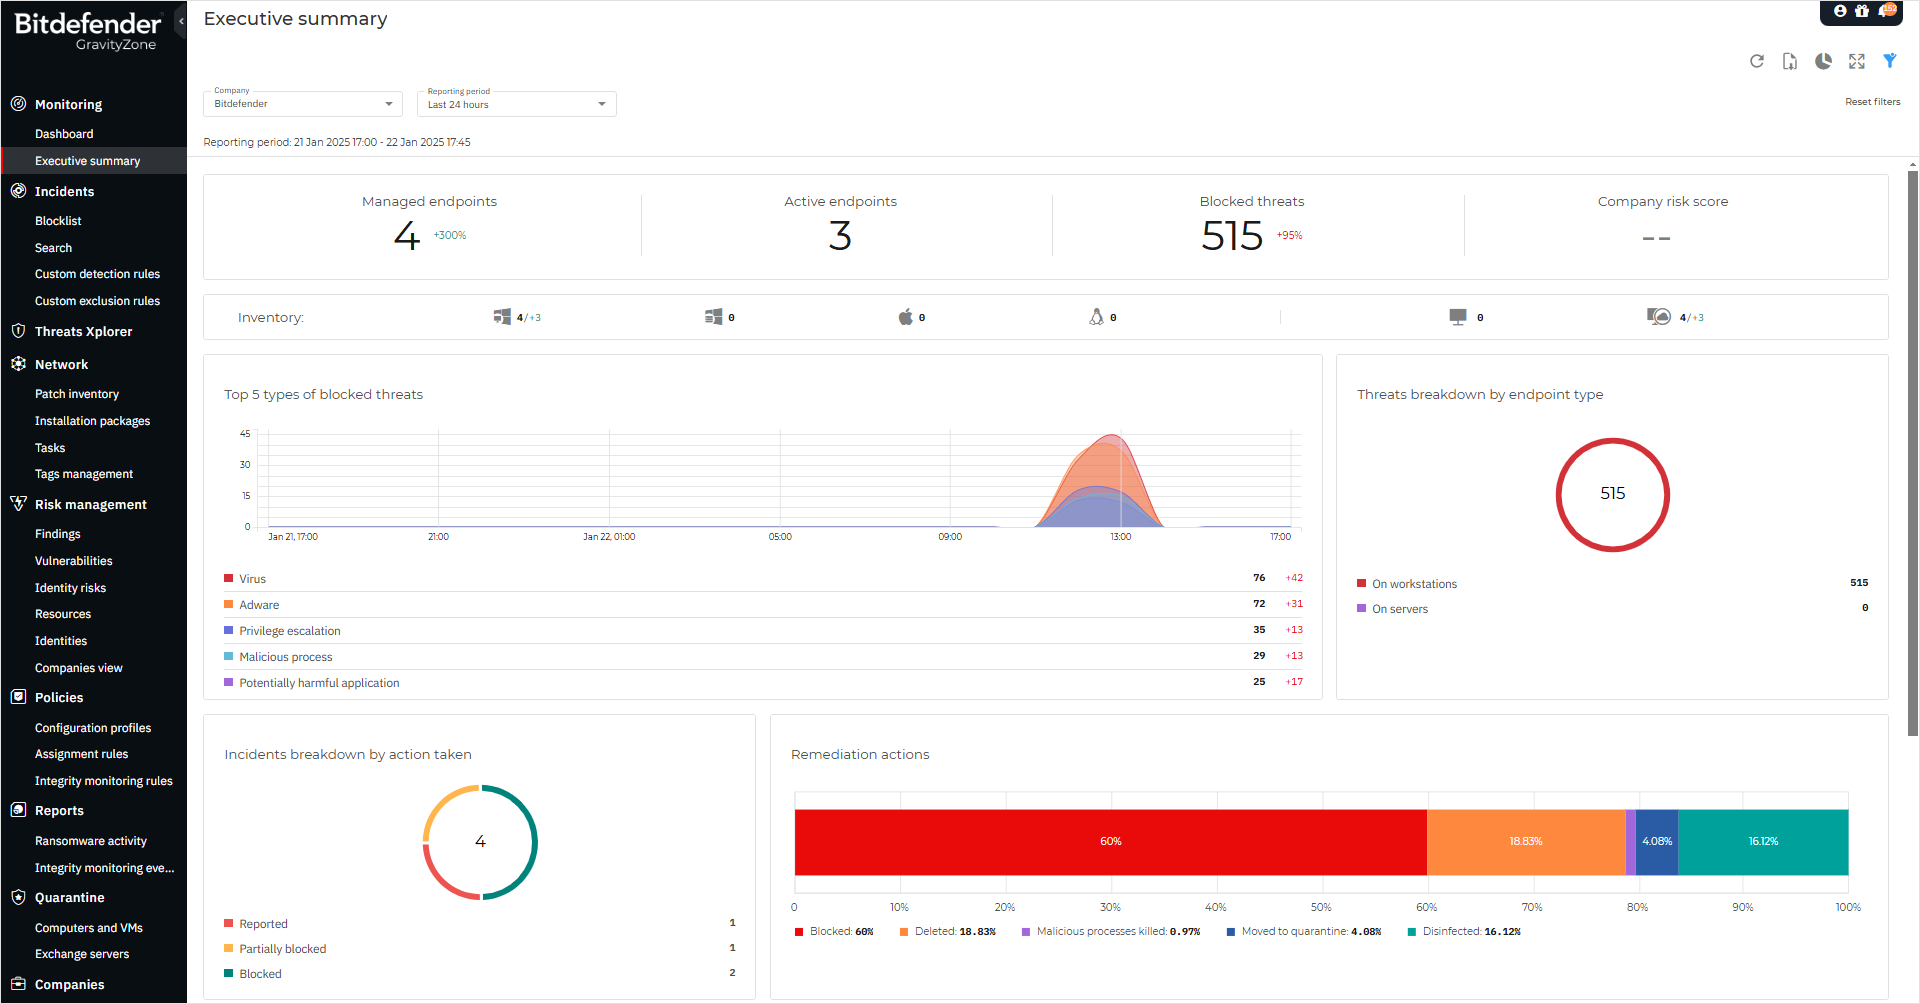
Executive Summary presents a concise security overview of all protected endpoints in your network and is specially designed to help you monitor, analyze, and provide executive management with easy-to-interpret data.
Composed mostly of widgets, enhances visibility by offering details about endpoint modules, detections, and taken actions, threat types and techniques, your company risk score, and others.
Important
All the provided statistics are based on data collected after enabling the feature. No prior events are included.
The Executive Summary feature is not available for Bitdefender EDR.
In the upper left corner of the page, you can find two filters:
Company: you can type the name of a company or select from the dropdown menu the company of interest. Please keep in mind that the summary provides statistics for a single company at a time and not for the entire tree structure.
Reporting period: you can select a predetermined time interval, relative to the current time, using one of the options Last 24 hours, Last 7 days, or Last 30 days.
Note
Date and time are reported according to your local settings.
The initial sections located on the upper side of the page are:
Managed endpoints
This section presents all the machines in your network that have the security agent installed.
In cases where you have no managed endpoints, you can easily install the security agents from this widget. For details, refer to Installing security agents.
Active endpoints
This section informs you about all the endpoints that were online in the selected period or are online at the moment of reporting.
Blocked threats
This section presents the total number of blocked threats identified on your endpoints.
Inventory
This section provides details about the endpoint types and their operating systems.
Company risk score
In this section, you can find information about your company's level of risk.
Note
All the presented data is directly correlated with the selected period and company.
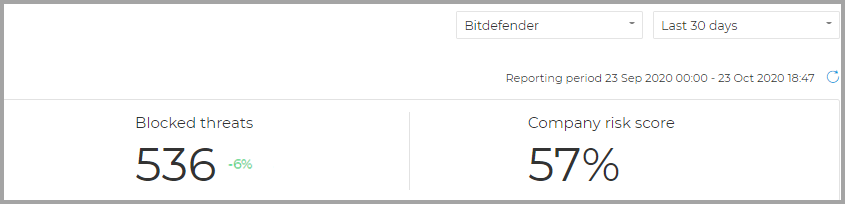
Depending on the selected interval, you may observe a difference (delta) shown as a percentage in some sections.
Delta values indicate the differences in your network that occurred between two specific periods:
The period prior to the selected interval with the same number of days or hours.
The selected interval.
For example, in the image below, the total number of blocked threats in your network has decreased by 6% in the Last 30 days. This percentage resulted after comparing values from the exact 30 days prior to the selected interval with values from the last 30 days.
The main widgets of the summary are:
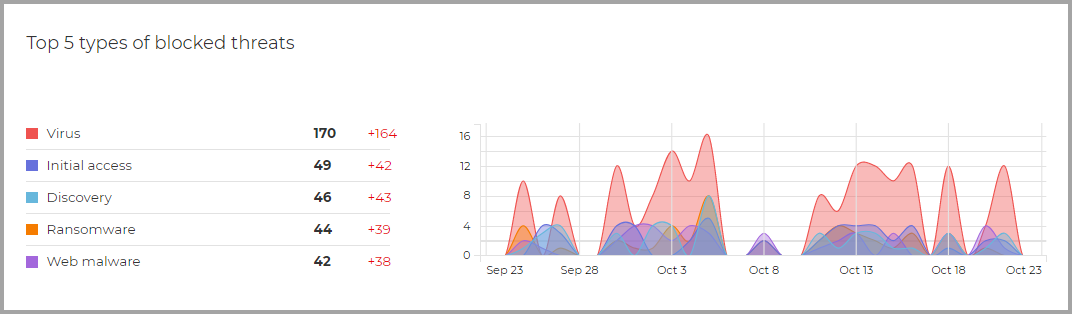
Top 5 types of blocked threats
The widget offers information about the most frequent threat types based on the number of detections on your endpoints. The column on the left displays the threat types and correlated in the right column you can find the number of detections for each type as well as delta values.
Threats breakdown by endpoint type
This widget presents the types of endpoints, workstations, servers, containers, container hosts, and the number of detections on each.
Incidents breakdown by action taken
This widget details the security incidents across the company network.
The incident categories are described as follows:
Reported - Endpoint and Organization incidents upon which no action was taken and require further investigation.
Partially blocked - Organization incidents in which the automatic actions defined in the policies have been taken only on some entities.
Blocked - Endpoint incidents that were detected and blocked by GravityZone prevention modules.
Remediation actions
This section describes the actions that were taken upon blocked items based on the applied policy settings.
Endpoint modules status
Provides an overview of the protection modules coverage for your endpoints. The chart presents the modules and whether they are enabled, disabled, or not installed on your endpoints.
Company risk score
This widget provides information about the level of risk your organization is exposed to by misconfigured system settings, known vulnerabilities of currently installed applications, and potential risks caused by user activity and behavior.
Policy rule-based detections
This section details the number of detections and their types based on rules customized in the policy by the administrator.
The detection types include:
Blocked devices - The number of detections based on Device Control rules.
Blocked connections - The number of detections based on Firewall rules.
Blocked applications - The number of detections based on Application Blacklisting rules.
Blocked websites - The number of detections based on Web Access Control rules.
Blocked websites
This widget presents the number of detections organized by threat types and identified on your endpoints by Network Protection.
Blocked network attack techniques
This section provides information about the blocked attack techniques discovered in your network.
The following options are available in the upper-right corner of the page:
Refresh - Reloads the page and updates it with the most recent information.
Export - Generates and downloads the summary in a PDF format, making it easy to save the information for further analysis.
Create report - Generates an Executive Summary report. For more information about the report, refer to Report Types.
Additionally, you have the option to hide, show, or reset the filters to customize your view based on your preferences or requirements. You can also use the fullscreen mode, which provides a larger workspace.
Exploring multidimensional data
Executive Summary provides you with the possibility to explore data by browsing from a statistical level to a more granular and detailed view. The drill-down capability helps you navigate instantly from widgets to specific sections of the Control Center.
To navigate from each widget:
Click the Monitoring page and select Executive Summary.
Find the widget of interest.
Click the widget’s title or content, depending on your selection. For example, if you want to view only the threats discovered on workstations, directly click On workstations instead of the widget’s title.
After your selection, you are automatically redirected to the corresponding area of the Control Center. Each section displays complex information in a customized way so that you can identify and analyze with ease the aspects you are interested in.
To navigate to the Threats Xplorer section where you can view in detail the detected threats in your network, use the following widgets:
Blocked threats
Top 5 types of blocked threats
Threats breakdown by endpoint type
Remediation actions
Policy rule-based detections
Blocked websites
Blocked network attack techniques
To navigate to the Network area where you can view the endpoints list, the corresponding operating systems, and versions, the types of endpoints, and others, use the following widgets:
Managed endpoints
Active endpoints
Inventory
The Company risk score widget redirects you to the Risk Management section, where you can find information about the level of risk your organization is exposed to by misconfigured system settings, known vulnerabilities of currently installed applications, and potential risks caused by user behavior.
The Incidents breakdown by action taken widget redirects you to the Incidents section, where you can view all the security events that are part of Endpoint or Organization incidents.
The Endpoint modules status widget automatically generates an Endpoint modules status report when accessed. The report provides details about the protection modules coverage for your endpoints.
Important
The sections to which you are redirected are automatically filtered according to your widget selection.
For example, when you click the Blocked threats widget and you are redirected to the Threats Xplorer page, the following columns will have preselected and active filters:
Endpoint type
Active filters: Workstation and Server
Detecting module
Active filters: Antimalware, Network Protection, Storage Protection, Exchange Protection
Action taken
Active filters (only remediation actions): Blocked, Deleted, Quarantined, Disinfected, Malicious process killed, Replaced attachment, Rejected/deleted email, Deleted attachment, Rejected email attachment
Detecting technology
Active filters: multiple GravityZone technologies corresponding to the selected modules
The reporting interval and the company are automatically correlated with your selection from the Executive Summary section.
Installing security agents
To install security agents, you can use the options Install now or Send download links available at the top of the Executive Summary page.
To download and install the security agent directly:
Click the Install now button. A download process begins.
The downloader is a small-sized file, and it can be run on 32-bit, 64-bit (Windows and Linux) systems, ARM64 systems (Windows only), or 64-bit macOS systems (both Intel x86 and Apple ARM architectures), and it requires an active Internet connection.
Run the installation package as follows:
Windows and macOS systems:
Run the package using administrative privileges.
Follow the on-screen instructions.
Linux systems:
Gain root privileges:
# sudo su
Change permissions to the installation file so that you can execute it:
# chmod +x installer
Run the installation file:
# ./installer
To check that the agent has been installed on the endpoint:
$ systemctl status bdsec*
After installation, you can view the endpoint in the Managed endpoints widget and in the Network page.
To quickly inform other users that an installation package is available to download:
Click the Send download links button. A configuration window will appear.
Enter the email address of each user you want to receive the installation package download link. You can add multiple addresses separated by a comma. Press Enter or click the Add button to create the desired list.
Note
Please make sure that each entered email address is valid and unique.
Click Send. An email containing the installation link is sent to each specified email address.
To install the security agents, you can use the above procedure based on your operating system.