System Status
The System Status page displays health status information of GravityZone deployment, making it easier for you to monitor system health and discover when something goes wrong.
The page provides system status, metrics, and update information:
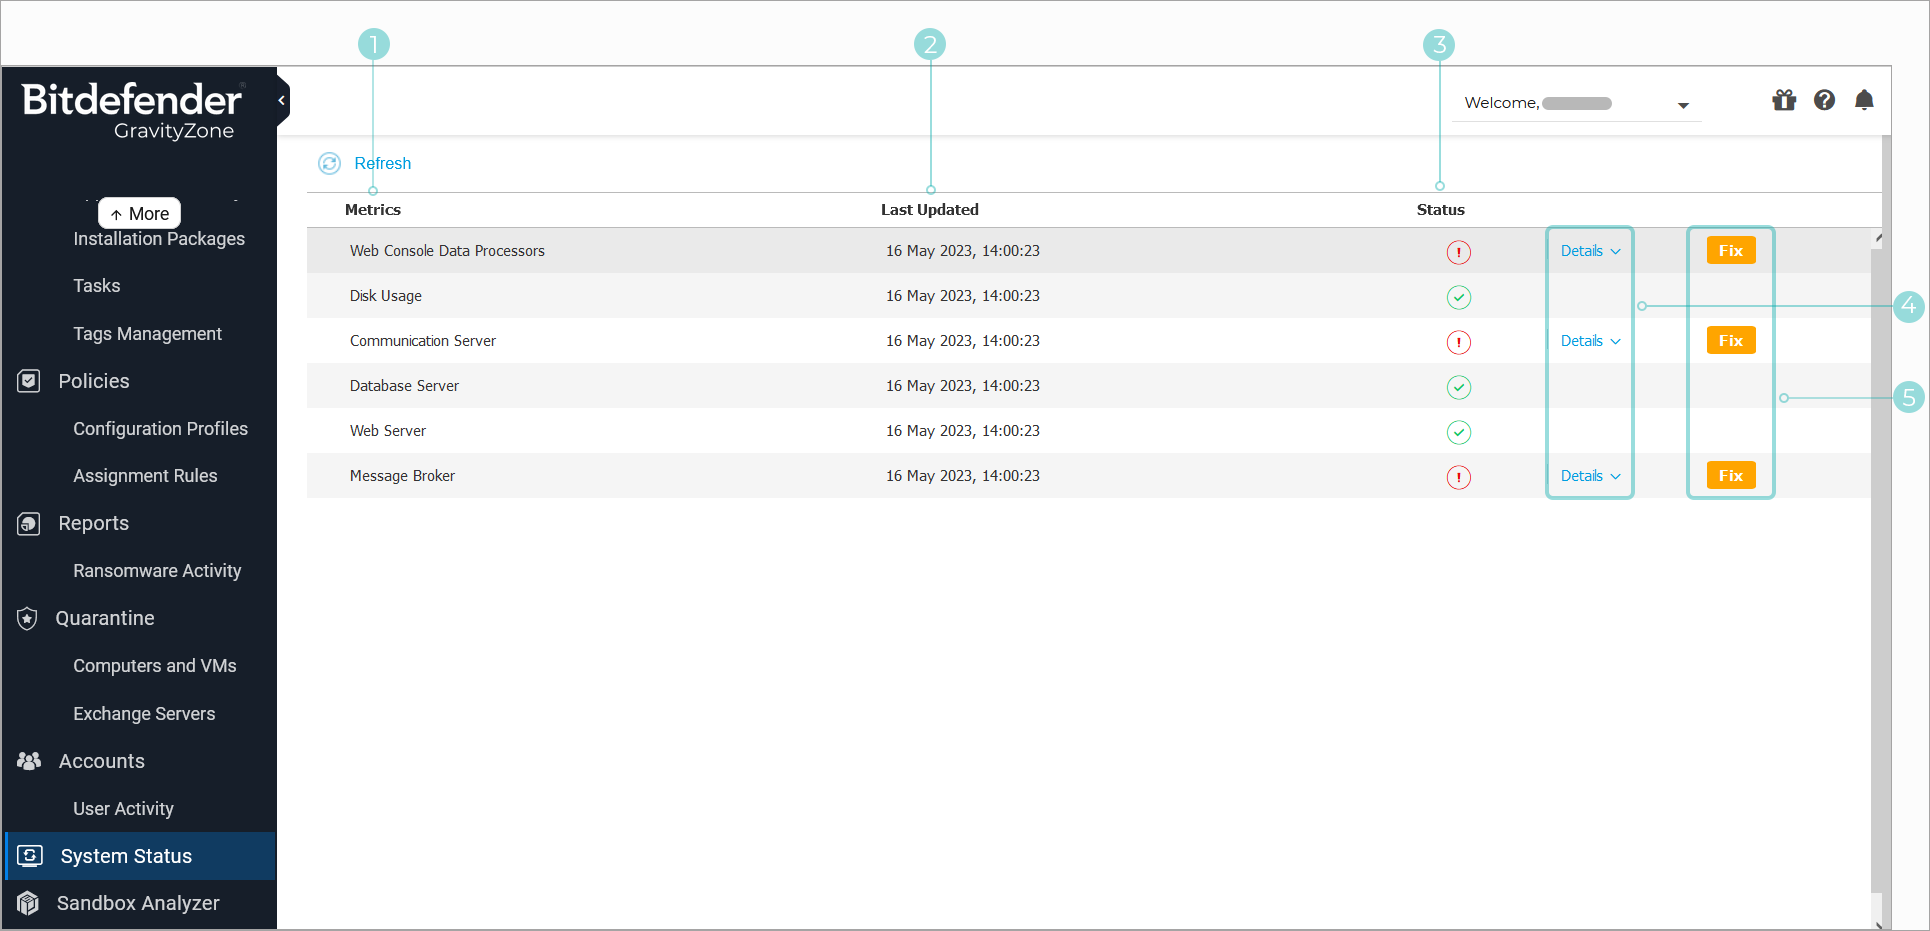
Metrics - displays all the indicators monitored by the GravityZone Control Center. For more details on every metric and status message, refer to Data processors.
Note
For metric-related issues, contact Technical Support.
Last Updated - displays the date and time of the latest status check for the respective metric.
Status - displays the state of each metric:
 Ok - the metric is behaving normally. No additional details are displayed.
 Attention - the metric is not running within normal parameters. Additional investigation is needed.
Note
The Status of a metric is updated automatically every 15 minutes. To manually refresh the list, click the
 Refresh button.
The Details button - expands a collapsible window that contains additional information regarding the metric:
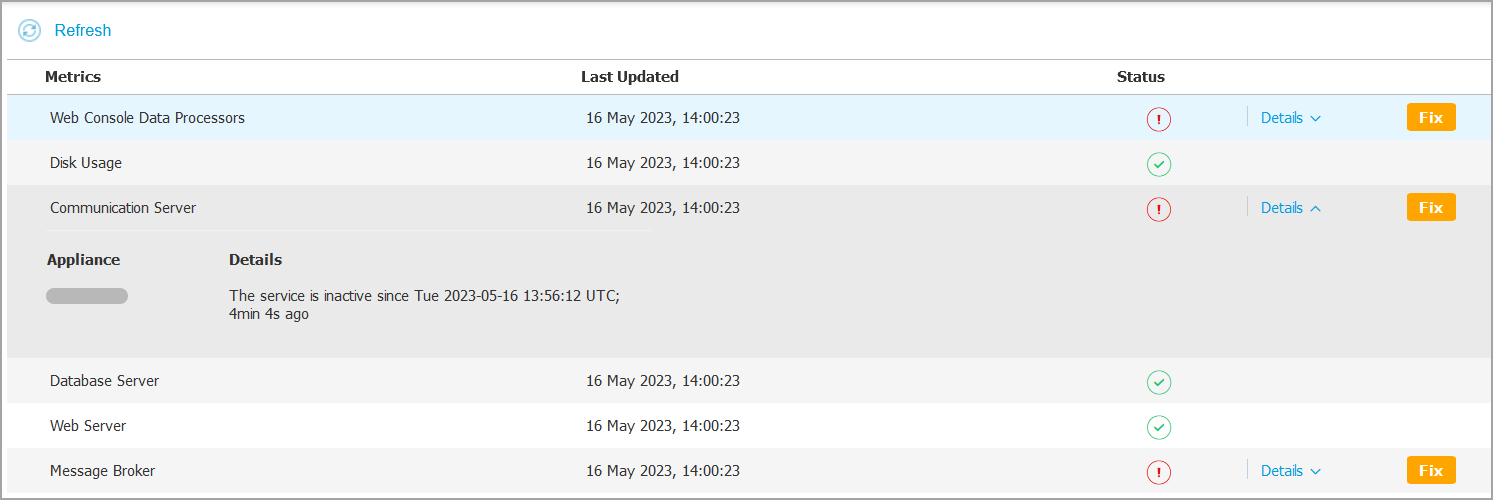
Appliance - the IP addresses of the affected machines.
Details - the information specific to each metric.
The Fix button - attempt to automatically repair the detected problem. This feature can only be used to repair certain scenarios.
Note
The Refresh button is not available while the Repair process is ongoing.
Depending on the detected issue, the process will be started automatically or you may be prompted to select between available options:
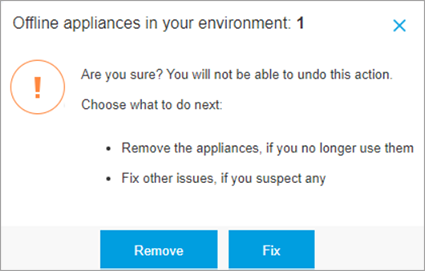
Example 2. A virtual appliance is down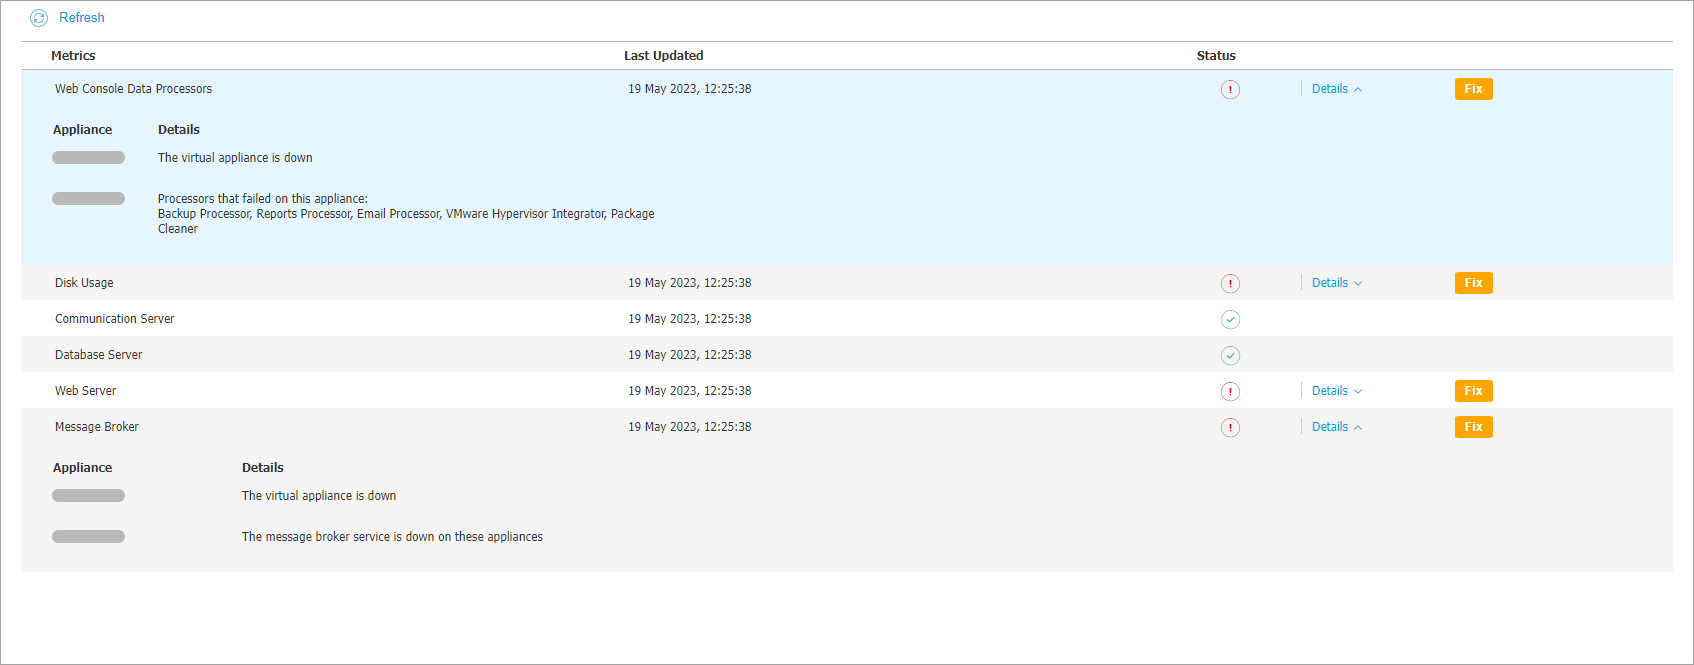
After clicking the Fix button, you are prompted to either remove the appliance, try and fix the issue, or cancel the request:
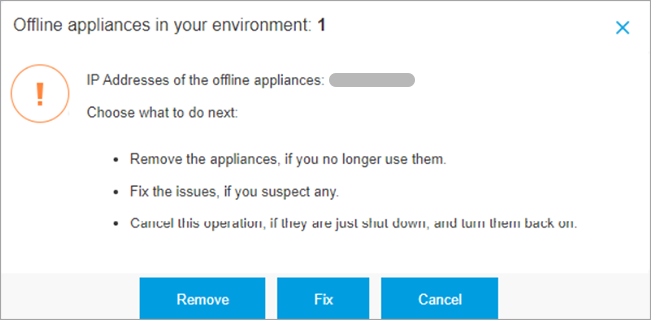
If you select Remove, a second window will appear to confirm the removal of the appliance:
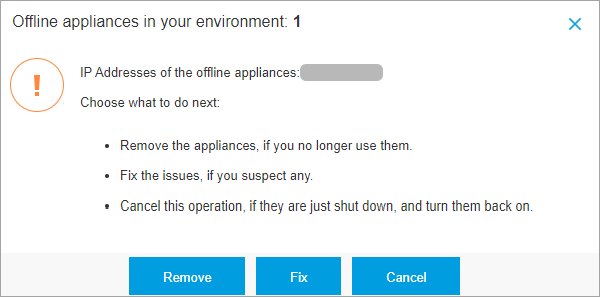
 Example 3. The metric has two appliances with issues
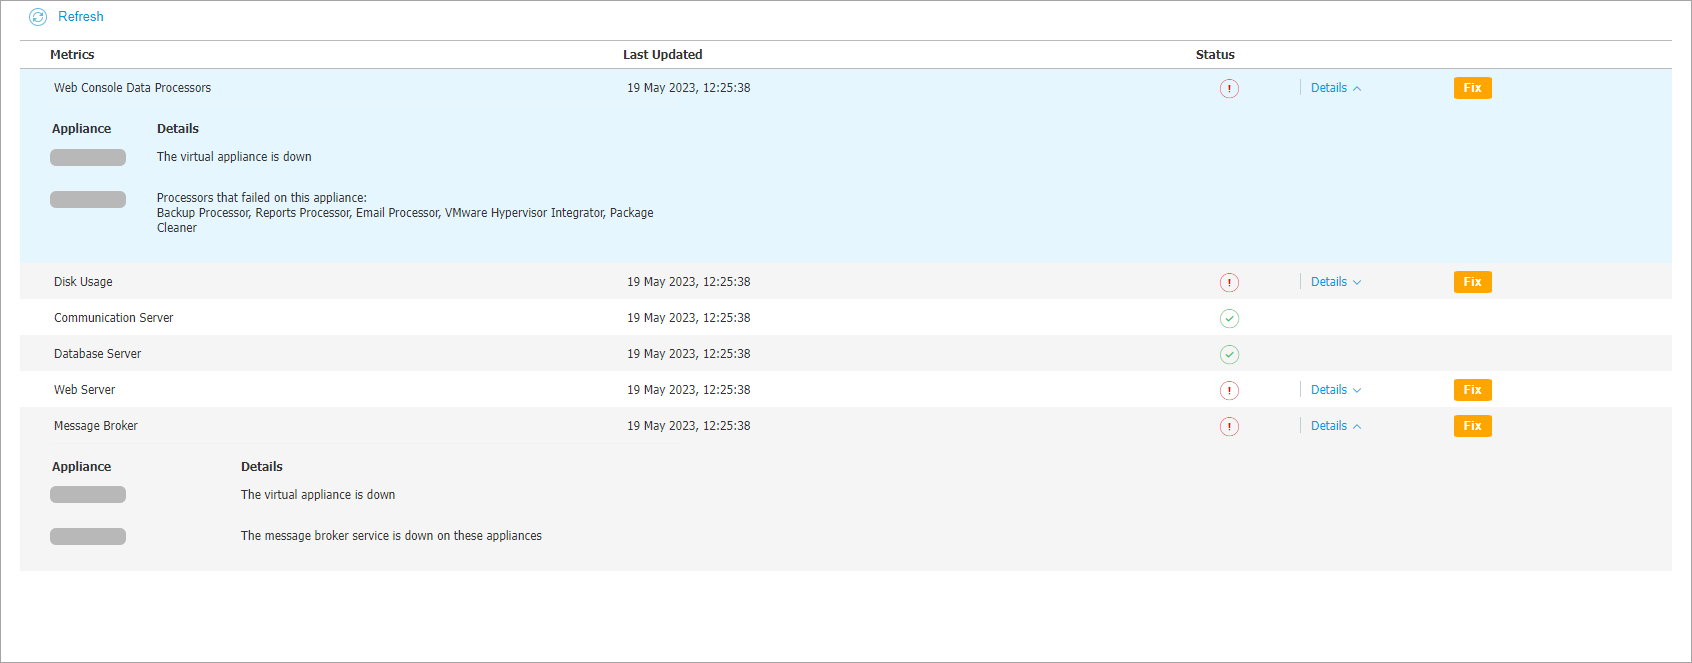
After clicking the Fix button, you will be prompted to either remove the appliance that is down, try and fix the issue for the appliance that is up, or cancel the request:
Metrics
The System Status page contains details about the following metrics:
Web Console Data Processors
This metric monitors the state of the data processors that are used for compiling the data displayed in Control Center.
Attention Status Message | Details |
|---|---|
Processors that failed on this appliance: <array of data processors> | One or more data processors are stopped. |
The virtual appliance is down | The virtual appliance using Web Console services is shut down or unreachable. |
For a complete list of processors used by Control Center, refer to Data processors.
Disk Usage
This metric monitors the amount of disk space used on each virtual appliance, how much free space is left, as well as total space on disk. If any of the disks is used above 80%, the metric displays the Attention status.
Attention Status Message | Details |
|---|---|
Used space on disk (disk name) | One or more disks are used above 80% of their maximum capacity. |
The virtual appliance is down | The reported virtual appliance is shut down or unreachable. |
Endpoint Communication Server and Endpoint Events Processing Server
This metric monitors the link between the security agents installed on your endpoints and the Database Server.
Attention Status Message | Details |
|---|---|
The service is inactive since <timestamp> | The service has stopped running. |
The virtual appliance is down | The virtual appliance using this server is shut down or unreachable. |
Database Server
This metric monitors the status of the GravityZone database.
Attention Status Message | Details |
|---|---|
The service is inactive since <timestamp> | The service has stopped running on one of the appliances. |
The virtual appliance is down | The virtual appliance using the Database Server is shut down or unreachable. |
Web Server
This metric monitors the state of the web server that hosts the GravityZone Control Center.
Attention Status Message | Details |
|---|---|
The service is inactive since <timestamp> | The server has stopped running on one of the appliances. |
The virtual appliance is down | The virtual appliance using this server is shut down or unreachable. |
Message Broker
This metric monitors the state of the message broker service on appliances with Web Console, Endpoint Communication Server and Endpoint Events Processing Server roles.
Attention Status Message | Details |
|---|---|
The message broker service is down on these appliances | The service has stopped running on one of the appliances. |
The network connection between appliances has failed | The connection between two appliances is broken. |
The virtual appliance is down | The virtual appliance using this service is shut down. |