Report Builder
In Control Center, you can create and manage queries to obtain detailed reports that allow you to understand any event or change that occurred in your network, at any time.
Queries provide you the possibility to investigate a security issue using various criteria, while keeping the information concise and well-ordered. With filters, you can group the endpoints by certain criteria and select relevant data for your purpose.
From a query-based report you can find out details such as when an incident occurred, how many endpoints are affected, which users were logged in at the time of the incident, what policies were applied, security agent status, actions taken, on a single endpoint or on a group of endpoints.
All query-based reports are available in Control Center, but you can save them to your computer or send them by email. Available formats include Portable Document Format (PDF) and comma-separated values (CSV).
With queries, you can take advantage of the multiple benefits comparing to the standard GravityZone reports:
High-volume data addressed to create compelling reports.
Flexible reporting due to fact that the events are not aggregated.
High level of customization. While standard GravityZone reports offer you the possibility to opt between a couple of predefined options, with queries there is no bound in choosing your data filters.
Event correlation, with any information being accompanied by agent and device status data.
Minimum development effort, as you can create, save and re-use any report type.
Comprehensive reports which, unlike standard reports, have summary and details integrated together in the same PDF document.
Queries can retrieve information for the past two years.
To use queries, you must install the Report Builder role along with your GravityZone virtual appliance. For details regarding Report Builder installation visit this section.
Query types
GravityZone comes with the following query types:
Endpoint status
This query provides you with information about the security status of the selected target endpoints, for a specific date. This way, you know if the security agent and the security content are updated, outdated or disabled. Also, you can view whether the endpoints are infected or clean, what infrastructure is used, and what modules are on/off or not installed.
This query includes details related to the target endpoints, such as:
Machine type (physical, virtual or Security Server).
Network infrastructure to which the endpoint belongs (Active Directory, Nutanix Prism, VMware or Citrix Xen).
Security agent data (type, status, scanning engines configuration, security status).
Protection modules status.
Endpoint roles (Relay, Exchange Protection).
Endpoint events
This query allows you to view details about security events occurred on the target endpoints, for a specific date or time period. It includes information related to:
Target machine on which the event took place (name, type, IP, OS, network infrastructure).
Type, status and configuration of the installed security agent.
Status of the protection modules and roles installed on the security agent.
Policy name and assignment.
Logged user during the event.
Events, which can refer to blocked websites, blocked applications, malware detections or device activity.
Exchange events
Helps you to find out the incidents produced on the selected Microsoft Exchange servers, at a specific date or for a certain time period. It takes into account data about:
Email traffic direction.
Security events (such as malware or attachment detection).
Actions taken on each situation (disinfect, delete, replace or quarantine file, delete or reject email).
Manage queries
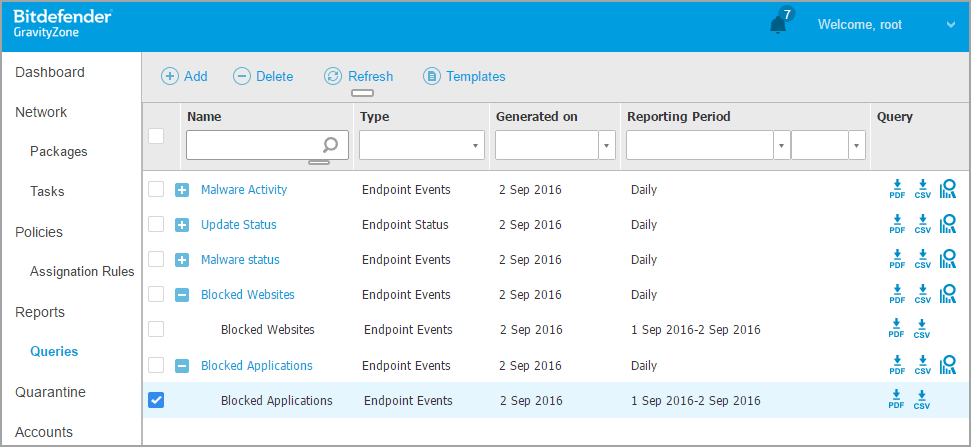
You can create and manage queries and query-based reports in the Report > Queries page.
Queries are complex database interrogations, using a high number of filters, which can take several minutes to configure and create. Having to fill the query form every time you want a new report, similar to existing reports, can become frustrating. GravityZone helps you to easily create queries with the use of templates, which automatically fill in the query form, leaving you less customization to do.
Using templates
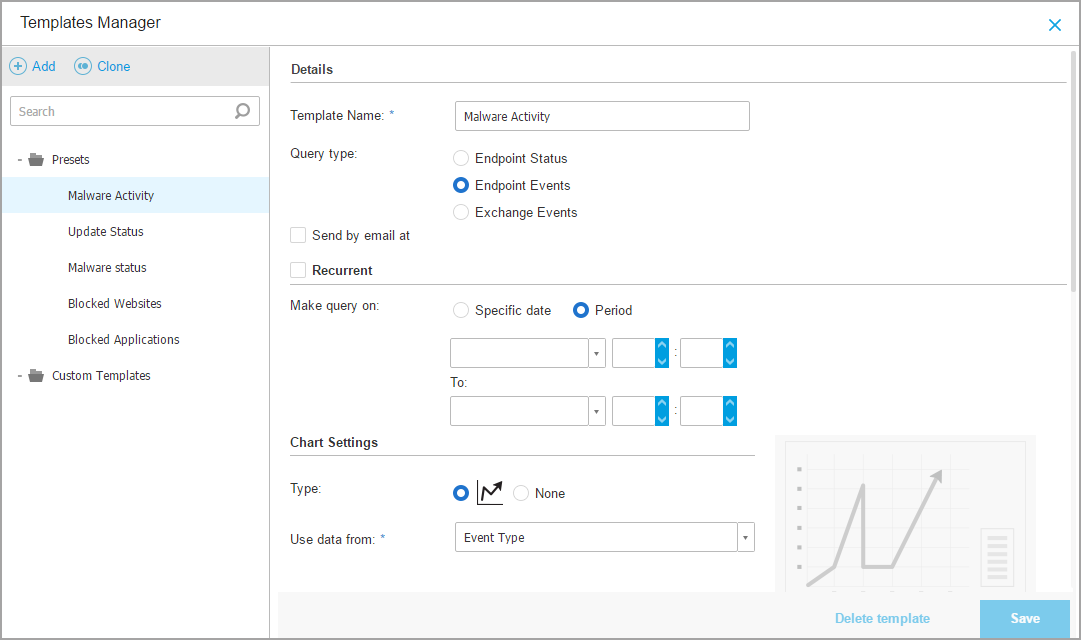
You can add, clone and fast search for specific templates in the Templates Manager window.
To view the available query templates, follow these steps:
Log in to GravityZone Control Center.
Go to the Reports > Queries page from the left side menu.
Click the
 Templates button above of the table. The Templates Manager window will be displayed. All templates are displayed in the left pane, while in the right pane you can view the settings of the selected template.
To quickly find a template, enter the name in the Search field, at the upper side of the left pane. You can view the search results as you type. To clear the Search field, click the  Delete icon on the right.
There are two available template categories:
Presets. These are predefined templates that come by default in GravityZone.
Custom templates. These are the templates you create according to your needs.
Presets
GravityZone includes five presets:
Malware Activity, providing you with information about the malware threats detected over a specific time period on selected endpoints.
The report contains target machine name, IP, infection status (infected or clean), malware name, action taken against the threat (ignored, present, deleted, blocked, quarantined, cleaned or restored), file type, file path and the user logged in at the moment.
Update Status, showing the update status of security agent installed on selected targets. The report contains target machine name, IP, product update status (updated, outdated, disabled), signature update status (updated, outdated, disabled), security agent type, product version and signature version.
Malware Status, which helps you to find out how many and which of the selected endpoints have been affected by malware over a specific time period and how the threats have been dealt with.
The report contains target machine name, IP, infection status (infected or clean), malware name, threat action (ignored, present, deleted, blocked, quarantined, cleaned or restored).
Blocked Websites, informing you about the activity of the Web Control module of the security agent.
The report contains target machine name, IP, threat type (phishing, fraud or untrusted), rule name, website category and the blocked URL.
Blocked Applications, which helps you to find out what applications have been blocked over a specific time period.
The report offers information on target machine name, IP, the blocked application name, its file path and how the threat was contained: with ATC, IDS or Application Control.
Custom Templates
If you need another template than the presets GravityZone provides, you can create custom query templates. You can save as many templates as you want.
To create a custom template, follow these steps:
Log in to GravityZone Control Center.
Go to the Reports > Queries page from the left side menu.
Click the
Templates button at the top of the table. The Templates Manager configuration window will be displayed.Click the
 Add button in the upper-left corner of the window. A query form will be displayed in the right-side pane.
Complete the query form with the required information. For details about completing a query form, refer to Creating Queries.
Click Save. The newly created template will be displayed in the left pane, under Custom Templates.
Alternately, you can create a custom template using a preset:
Log in to GravityZone Control Center.
Go to the Reports > Queries page from the left side menu.
Click the
Templates button at the top of the table. The Templates Manager configuration window will be displayed.Select a preset in the left-side pane. The corresponding settings will be displayed in the right-side pane.
Click
 Clone in the upper-left corner to create a copy of the preset.
Edit all settings you want in the query form. For details about completing a query form, refer to Creating Queries.
Click Save. The newly created template will be displayed in the in the left pane, under Custom Templates.
Also, when creating a new query, you can save it as a template. For more information, refer to Creating Queries .
To delete any custom template, follow these steps:
Log in to GravityZone Control Center.
Go to the Reports > Queries page from the left side menu.
Click the
 Templates button at the top of the table. The Templates Manager configuration window will be displayed.
Under the Custom Templates section, click the template you want to delete. The template settings will be displayed in the right-side pane.
Click Delete template at the lower-side of the window. Click Yes to confirm your action.
Creating queries
To create a new query, follow these steps:
Log in to GravityZone Control Center.
Go to the Reports > Queries page from the left side menu.
Click the
Add button at the top of the table. A configuration window is displayed.Select Use template check box if you want to use a default or a previously created template.
Under Details section, enter a suggestive name for the query. When choosing a name, consider query type, targets and other settings.
Select the query type. For more information, refer to Query types.
Select Send by email to check box to send the query results to certain recipients. In the corresponding field, add as many email addresses as you want.
Under the Recurrence section, select:
Specific date for a certain day.
Period, for an extended time interval.
Click the Recurrent check box if you want the query to be generated at specific intervals that you can set in the Reporting Period area.
Configure the chart settings.
From the Type menu, select the chart you want to illustrate the query, or choose None to omit it. Depending on query type and reporting period, you can use a pie chart, a bar chart, or a line chart.
In the Take values from field select the data categories you want to use for your query. Each query type provide specific information related to endpoints, security agents and security events. For details regarding type data, refer to Query types.
Under Table Settings section, select the columns you want the report to contain. The data you can select depend on the query type, and they may refer to endpoint type and OS, security agent status and events, modules, policy, and security events. All selected columns are displayed in the Columns table. Use drag-and-drop to change their order.
Note
Keep in mind the space available when creating the table layout. Use maximum 10 columns for a good table visualization in PDF.
In the Filters section, select the dataset you want the report to contain using the available filtering criteria:
From the Filter Type menu, choose a filter and then click
Add filter.In the table below, click Value to specify one or more filter options.
For example, the Host OS filter requires specifying OS name, such as Windows or Linux, while the Device Control Module filter allows you to select from a drop-down list the endpoints where the module is disabled.
Click the
Delete button to eliminate a filter.
Select Targets. Scroll down to configure the report targets. Select one or several groups of endpoints you want to include in the report. Using the Views Selector, make sure you have checked the correct targets in all network views.
Select the Save as template check box to use these settings in further queries. In this case, enter a suggestive name for the template.
Click Generate to create the query. Once the query is saved, you will receive a message in the Notifications area.
Delete queries
To delete a query, follow these steps:
Log in to GravityZone Control Center.
Go to the Reports > Queries page from the left side menu.
Select the report you want to delete.
Click the
Delete button above the table.
Note
Deleting a query will also delete all generated reports.
View and manage reports
All query-based reports are displayed in the Reports > Queries page.
Note
Reports are available only for the user who has created them.
Viewing Reports
To view a query-based report, follow these steps:
Log in to GravityZone Control Center.
Go to the Reports > Queries page from the left side menu.
Sort reports by name, type, date of generation or reporting period to easily find what you are looking for. By default, reports are ordered by the date of the last generated instance.
Click any name to view query information in a new window. The details cannot be edited.
Click the plus button in front of a query name to expand the list of a report instances and the minus button to collapse it.
Click the
 View report icon to display most recent instance of a report. Older instances are only available in PDF and CSV formats.
All reports consist of a summary section in the upper side of the report page, and a details section in the lower half of the report page.
The summary section provides you with statistical data (pie charts, bar charts, or line charts) for all target endpoints, general information about the query, such as recurrence, reporting period, query type, and filters used.
To configure the information displayed by the chart, click the legend entries to show or to hide the selected data. Also, click the area you are interested in the graphic to view related data in the table.
The details section provides you with information on each target endpoint. To quickly find the data you want, click the search fields or the filtering options below the column headers.
Click the  Columns button to customize which columns to view in the table.
Saving Reports
By default, all reports are automatically saved in Control Center. You can also export them to your computer, both in PDF and CSV format.
You can save reports to your computer:
From the report page.
From the Queries table.
To save a report while you are on its page, use the steps below:
Click the
 Export button on the lower-left corner.
Select the desired format of the report:
Portable Document Format (PDF) or
Comma-Separated Values (CSV)
Depending on your browser settings, the file may be downloaded automatically to a default download location, or a download window will appear, where you must specify the destination folder.
To export a report while you are in the Reports > Queries page, follow these steps:
Go to the Reports > Queries page from the left side menu in GravityZone Control Center.
Click the
 PDF or
  CSV buttons corresponding to each report.
Depending on your browser settings, the file may be downloaded automatically to a default download location, or a download window will appear, where you must specify the destination folder.
All reports exported in PDF format have the summary and the details in the same document, on separated A4 portrait or landscape-oriented pages. The details are limited to 100 rows per PDF document.
Emailing Reports
You have two options to send reports by email:
In the page of the report you are viewing, click the
 Email button in the lower-left corner of the page. The report will be sent to the email address associated to your account.
When creating a new query, select Send by email to check box and enter the email addresses you want in the corresponding field.
Printing Reports
Control Center does not currently support print button functionality. To print a query-based report, you must first save it to your computer.