Viewing endpoint details
Viewing computer details
You can obtain detailed information about each computer within the Network page, as follows:
Checking the Network page
To find out details about a computer, check the information available in the right-side pane table from the Network page.
You can add or remove columns with endpoint information by clicking the  Columns button at the upper-right side of the pane.
Log in to GravityZone Control Center.
Go to the Network page from the left side menu.
Choose Computers and Virtual Machines from the views selector.
Select the group that you want from the left-side pane.
All endpoints available in the selected group are displayed in the Network page.
You can easily identify the computer status by checking the corresponding icon. For detailed information, refer to Checking the computer status.
Check the information displayed on columns for each computer.
Use the header row to search as you type for specific endpoints, according to the available criteria:
Name: endpoint name.
FQDN: fully qualified domain name.
OS version: the version of the operating system installed on the endpoint.
OS type: the type of the operating system installed on the endpoint.
IP: endpoint's IP address.
Last seen: date and time when the endpoint has last been seen online.
Note
It is important to monitor the Last Seen field as long inactivity periods might indicate a communication issue or a disconnected computer.
Label: a custom string with additional information about the endpoint. You can add a label in the endpoint's Information window and then use it in searches.
Policy: the policy applied to the endpoint, with a link for viewing or changing the policy settings.
Endpoint type: the type of the machine, server or workstation.
Users: the logged in users. For only one logged in user, their name will be displayed. Otherwise, the table displays the number of users. To see data related to logged in users in GravityZone, you must enable the Allow endpoints to send user login data to GravityZone option in the policies from General > Settings > Options section, as it is disabled by default.
Tip
Users column contains links to pages with further details on the topic.
Checking the Information window
In the right-side pane of the Network page, click the name of the endpoint you are interested in to display the Information window. This window displays only the data available for the selected endpoint, grouped under several tabs.
Find hereafter the exhaustive list of information you may find in the Information window, according to the endpoint type and its specific security information.
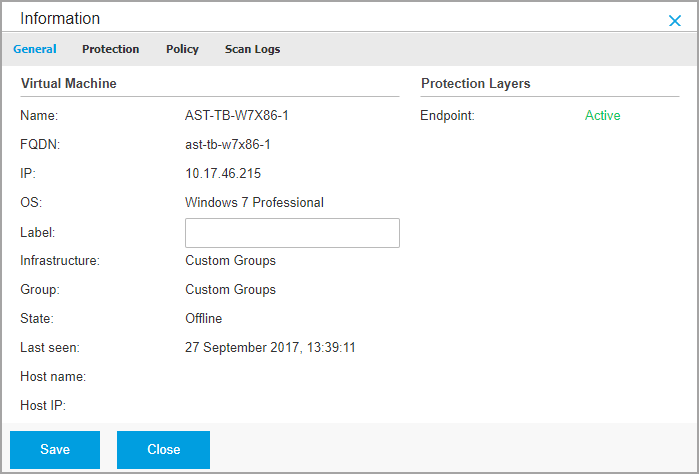
General tab
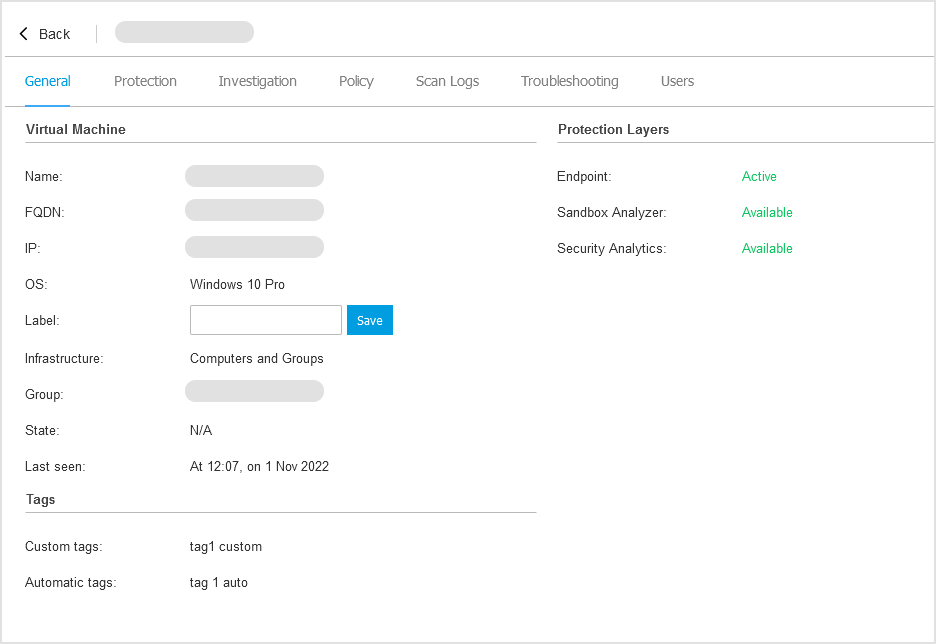
General computer information, such as name, FQDN information, IP address, operating system, infrastructure, parent group and current connection status.
In this section, you can assign the endpoint with a label. You will be able to quickly find endpoints with the same label and take actions on them, no matter where they are located in the network. For more information about filtering endpoints, refer to sorting, filtering and searching for endpoints.
In this section you also can view the custom and automatic tags assigned to the endpoint. For details, refer to Using endpoint tags.
Protection layers information, including the list of security technologies acquired with your GravityZone solution and their license status, which can be:
Not Licensed - the GravityZone partner does not have a license key for this protection layer.
Available / Active – the license key for this protection layer is active on the endpoint.
Expired – the license key for this protection layer is expired.
Pending – the license key is not confirmed yet.
Note
Additional information on the protection layers is available in the Protection tab.
Relay Connection: the name, IP and label of the relay to which the endpoint is connected, if the case.
Password details for Security Server and Network Sensor instances. Details include last change date, expiry date, and maximum password age (in days). For more information, refer to Change security appliance password.
Protection tab
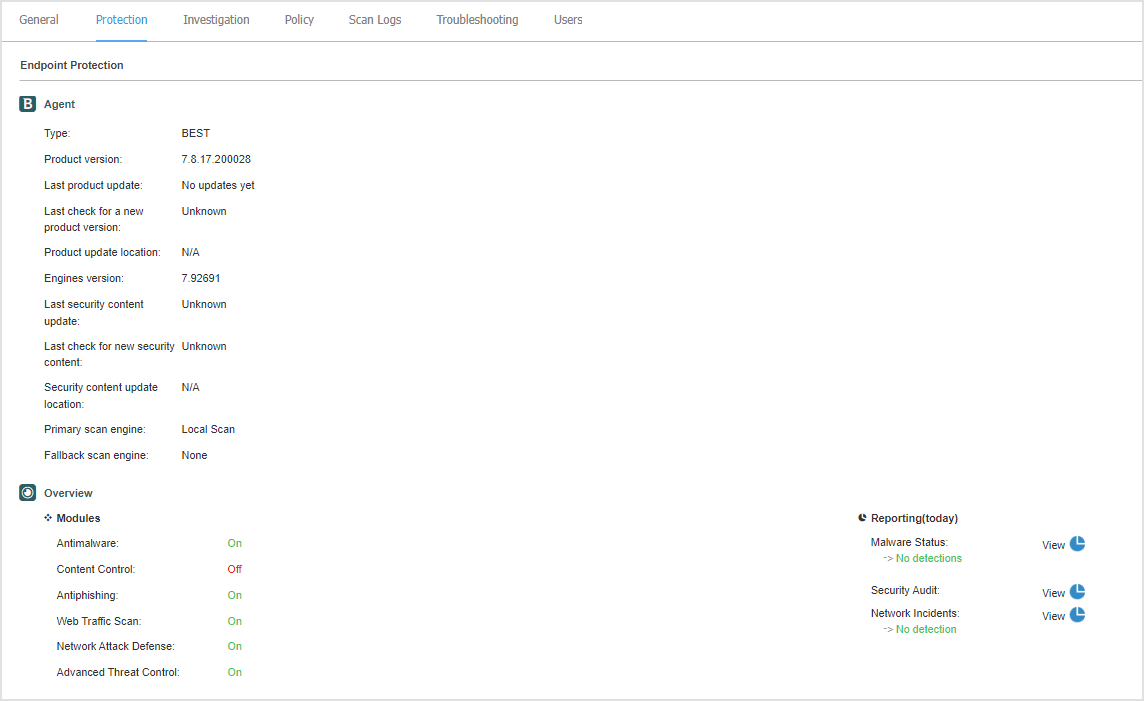
This tab contains details about each protection layer licensed on the endpoint. Details refer to:
Security agent information like product name, version, update status, and update locations as well as scanning engines configuration and security content versions. For Exchange Protection, antispam engine version is also available.
Security status for each protection layer. This status appears at the right side of the protection layer's name:
Secure, when there are no security issues reported on the endpoints applied with the protection layer.
Vulnerable, when there are security issues reported on the endpoints applied with the protection layer. For more details, refer to Security Status.
Associated Security Server. Each assigned Security Server is displayed in case of agentless deployments or when scanning engines of the security agents are set to use remote scan. Security Server information helps you identify the virtual appliance and get its update status.
The protection modules status. You can easily view which protection modules have been installed on the endpoint and also the status of available modules (On / Off) set via the applied policy.
A quick overview regarding the modules activity and malware reporting in the current day.
Click the
 View link to access the report options and then generate the report. For more information, refer to Creating reports
Information regarding the Sandbox Analyzer protection layer:
Sandbox Analyzer usage status on the endpoint, displayed at the right side of the window:
Active - Sandbox Analyzer is licensed (available) and enabled via policy on the endpoint.
Inactive - Sandbox Analyzer is licensed (available) but not enabled via policy on the endpoint.
Name of the agent that acts as feeding sensor.
Module status on the endpoint:
On - Sandbox Analyzer is enabled on the endpoint via policy.
Off - Sandbox Analyzer is not enabled on the endpoint via policy.
Threat detections in the last week by clicking the
View link to access the report.
Information regarding the Encryption module, such as:
Detected volumes (mentioning the boot drive).
Encryption status for each volume (which can be Encrypted, Encryption in progress, Decryption in progress, Unencrypted, Locked or Paused).
Click the Recovery link to retrieve the recovery key for the associated encrypted volume. For details about retrieving the recovery keys, refer to Using Recovery manager for encrypted volumes.
Investigation tab
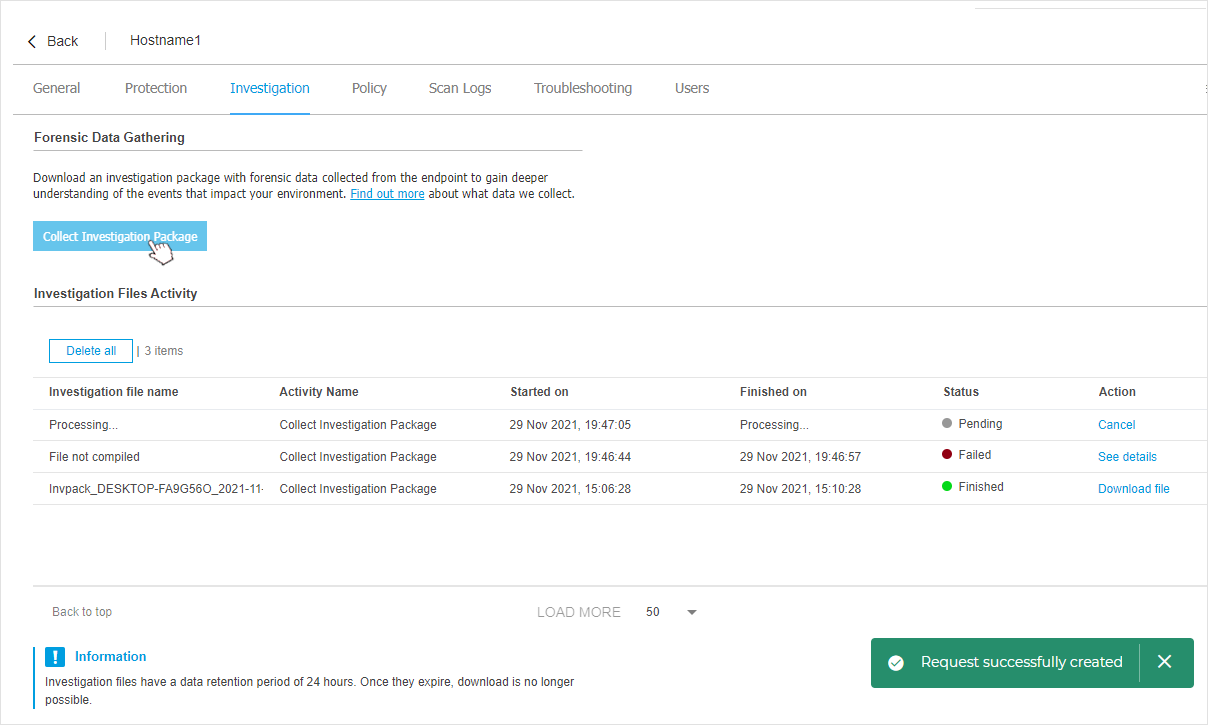
In the Investigation tab you can collect forensic data from the endpoint to analyze and investigate possible threats to your environment.
In the Network page, select the managed endpoint you want to collect forensic data from and open its details page.
Go to the Investigation tab, and click Collect Investigation Package to start compiling an archive with forensic data.
Note
If the button is inactive, a tooltip will be displayed, with the reason why the action is unavailable. For more details see ???
A toast message will inform you that the data collection request was successfully created.
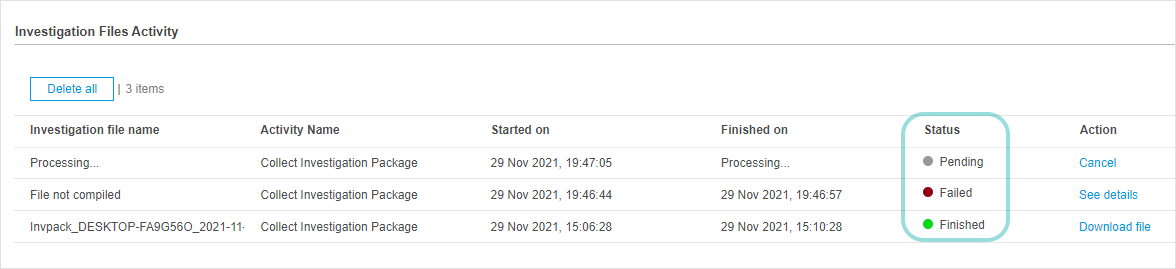
You can track its progress in the Investigation Files Activity grid.
You can view the current collection process (the status of the activity in progress is set to Pending), along with other data gathering activities performed in the past 24 hours.
Note
Collection activities that were canceled by user or could not be completed for various reasons have the status set to Failed .
When the data collection process has completed successfully, the action status changes to Finished, and the archive with collected forensic artifacts is available for download.
Click Download file in the Actions column to download the archive locally and analyze the collected data.
Note
To find out more details about the type of data collected as part of an investigation package see ???.
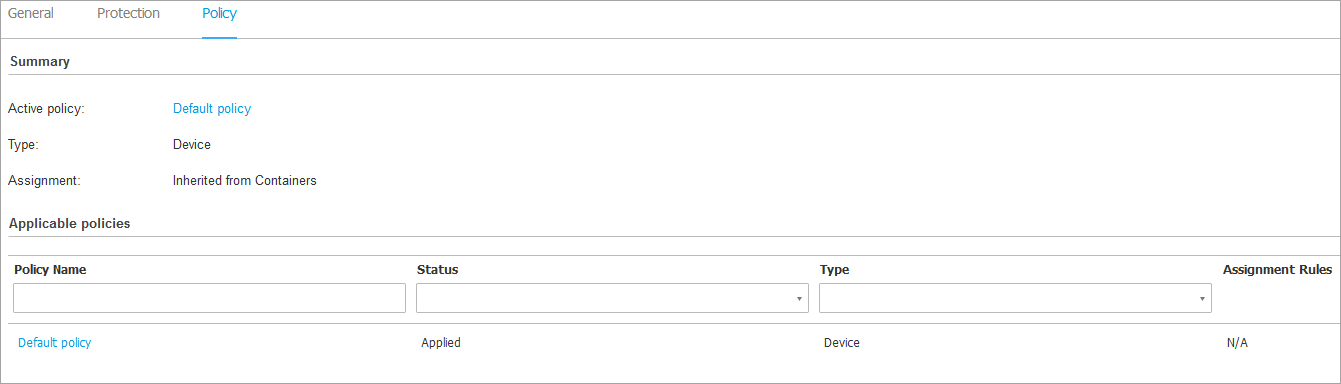
Policy tab
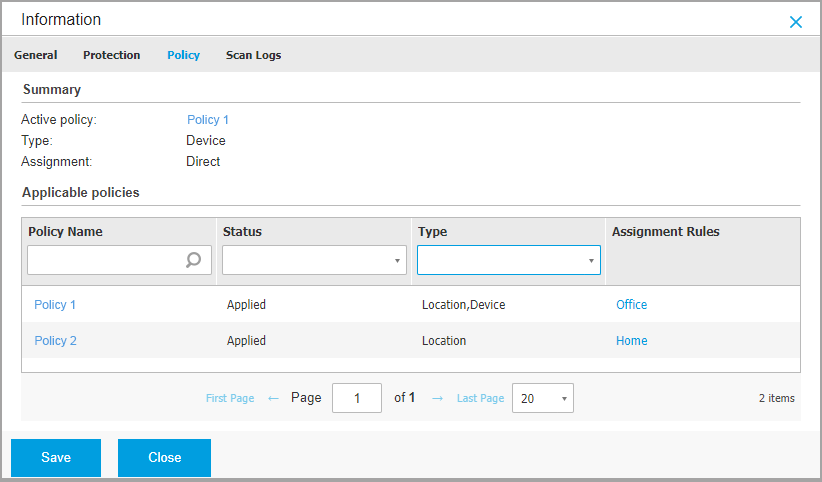
An endpoint can be applied with one or more policies, but only one policy can be active at a time. The Policy tab displays information about all policies that apply to the endpoint.
The active policy name. The active policy is the policy currently in use on the endpoint.
Click the policy name to open the policy template and view its settings.
The active policy type, which can be:
Device: the policy is the default policy or is manually assigned to the endpoint by the network administrator.
Location: a rule-based policy automatically assigned to the endpoint if the endpoint's network settings match the given conditions of an existing assignment rule.
For example, a laptop has assigned two location-aware policies: one named
Office, which is active when it connects to the company's LAN, andRoaming, which becomes active when the user works remotely and connects to other networks.User: a rule-based policy automatically assigned to the endpoint if it matches the Active Directory target specified in an existing assignment rule.
Computer group: a rule-based policy automatically assigned to the endpoint if it matches the Active Directory targets specified in an existing assignment rule.
Endpoint tag: a rule-based policy automatically assigned to the endpoint if it matches all the tags specified in an existing assignment rule.
Integration tag: a rule-based policy automatically assigned to the endpoint if it matches all the Amazon E2 tags specified in an existing assignment rule.
External (NSX): when the policy is defined in the VMware NSX environment.
The active policy assignment type, which can be:
Direct: when the policy is directly applied to the endpoint.
Inherited: when the endpoint inherits the policy from a parent group.
Applicable policies: displays the list of policies linked to existing assignment rules. These policies may apply to the endpoint when it matches the given conditions of the linked assignment rules.
Depending on their status displayed in the table, policies can be:
Applied: the policy has been received by the endpoint.
An applied policy may or may not be the active policy, depending on whether the conditions defined by the assignment rule are currently met. The active policy is included in the list with the Applied status.
Endpoints can have multiple policies assigned at the same time through assignment rules, but only one policy can be active at a time.
Pending: the policy has not been received by the endpoint yet.
You cannot removed applied or pending policies from the Applicable policies table.
For more information regarding policies, refer to Configuring policies.
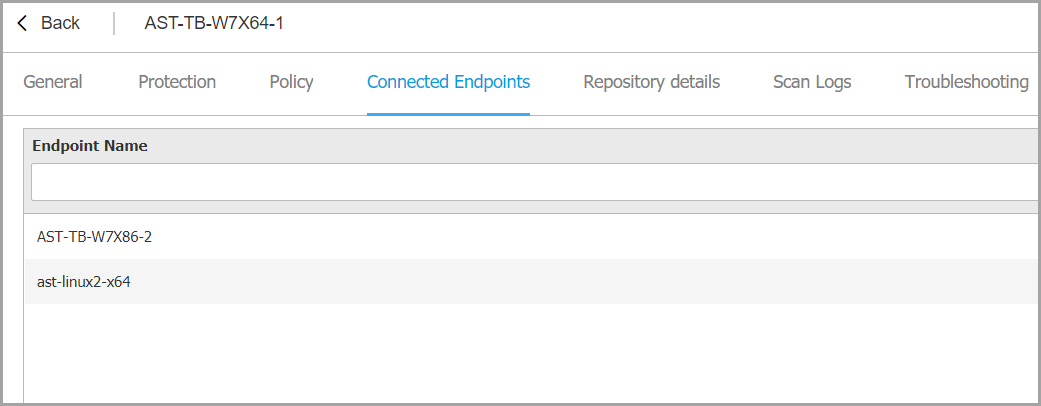
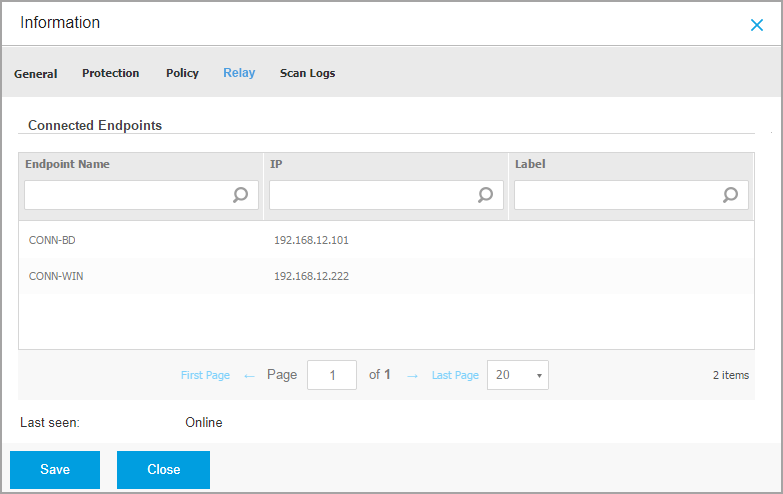
Connected Endpoints tab
The Connected Endpoints tab is available only for endpoints with relay roles. This tab displays information about the endpoints connected to the current relay, such as name, IP, and label.
Repository details tab
The Repository details tab is available only for endpoints with relay roles and displays information about the security agent updates and security content.
The tab includes details about the product and signatures versions stored on the relay and the ones available in the official repository, update rings, the date and time of the update, and last check for new versions.
Note
The product versions are not available for Security Servers.
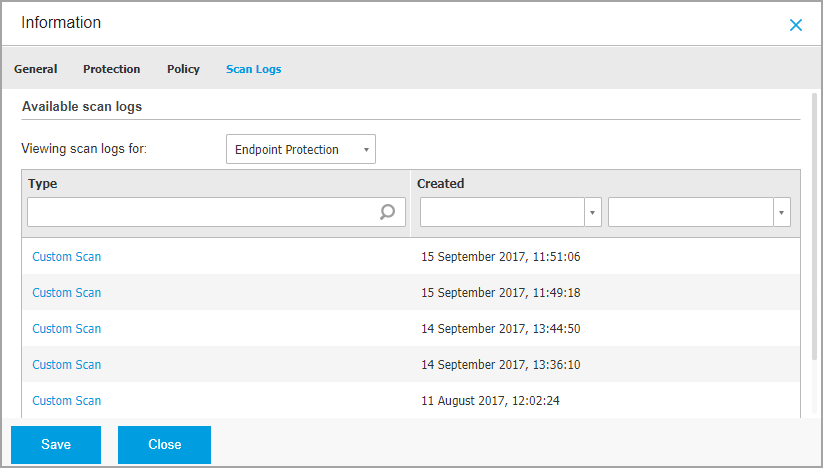
Scan Logs tab
The Scan logs tab displays detailed information about all scan tasks performed on the endpoint.
Logs are grouped by protection layer and you can choose from the drop-down menu for which layer to display logs.
Click the scan task you are interested in and the log will open in a new page of the browser.
When many scan logs are available, they may span through several pages. To move through the pages, use the navigation options at the bottom of the table. If there are too many entries, you can use the filter options available at the top of the table.
Troubleshooting tab
This section is dedicated to agent troubleshooting activity. You can gather general or specific logs from the endpoint check or take action on current troubleshooting events and view previous activity.
Important
Troubleshooting is available for Windows, Linux, macOS, and all Security Server types.
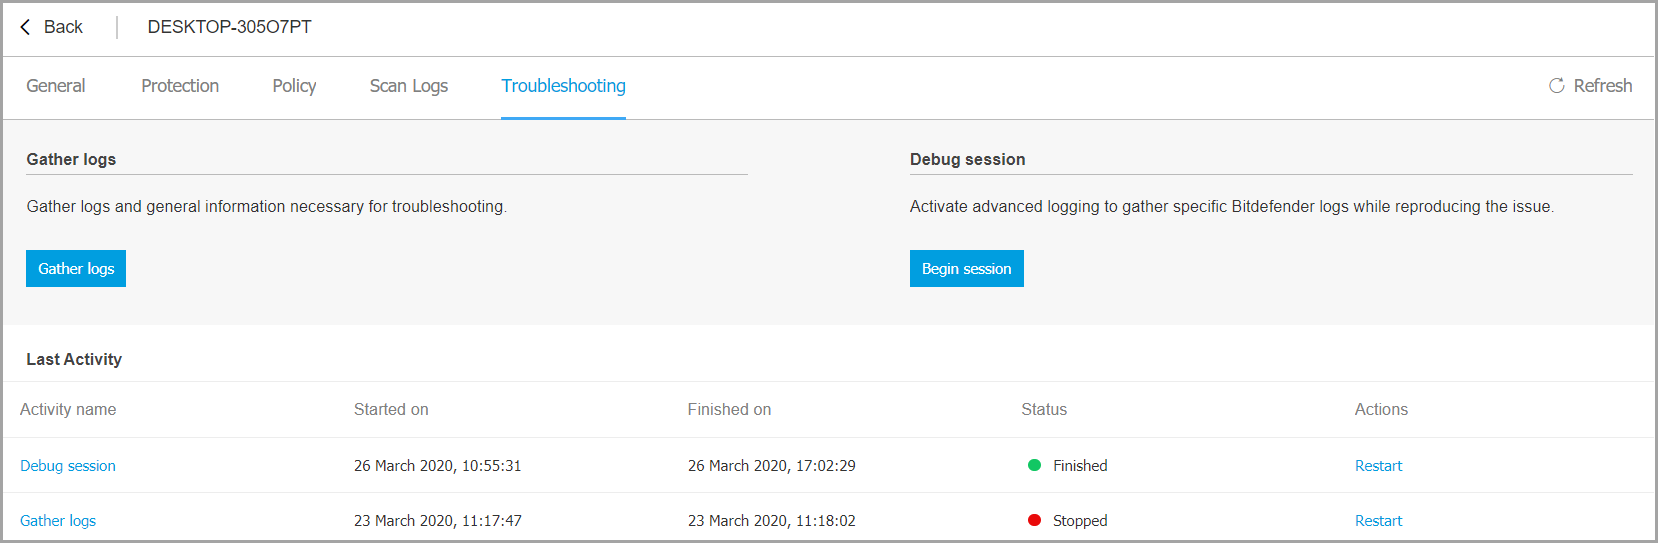
Gather endpoint logs
This option helps you gather a set of logs and general information necessary for troubleshooting such as endpoint settings, active modules, or applied policy specific to the target machine. All the generated data is saved in an archive.
It is recommended to use the option when the cause of the issue is unclear.
To start the troubleshooting process:
Click the Gather logs button.
A configuration window is displayed.
Under Select log type, chose one of the following options:
Product general issues - gather logs related to product issues.
Malware infection - gather logs that can be linked to malware infections and attacks.
Malware infection (no cloud services) - gather logs that can be linked to malware infections and attacks without contacting Bitdefender Cloud Services to check for threat intelligence data.
Under Logs Storage, select a storage location:
Target machine - the logs archive is saved to the provided local path. The path is not configurable for Security Servers.
Network share - the logs archive is saved to the provided path from the shared location.
You can use the option Save logs also on target machine to save a copy of the logs archive on the affected machine as a backup.
Fill in with the necessary information (local path, credentials for the network share, path to the shared location) depending on the selected location.
Click the Gather logs button.
Debug session
With Debug session, you can activate advanced logging on the endpoint to gather specific logs while reproducing the issue.
You should use this option when you have discovered which module is causing issues or at the recommendation of Bitdefender Enterprise Support. All the generated data is saved in an archive.
To start the troubleshooting process:
Click the Begin session button. A configuration window is displayed.
In the Issue type section, select the issue you consider is affecting the endpoint:
Issue type
Use case
Antimalware (on-access and on-demand scanning)
Endpoint general slowdown
A program or system resource takes too long to respond
A scanning process takes longer than usual
No connection to host security service error
Update errors
Error messages received during product or security content updates.
Content Control and Firewall
The website does not load
Elements of the web page are not displayed properly
Firewall communication issues
Firewall rules do not apply properly
Firewall blocks applications
Firewall is not working properly
Cloud Services connectivity
The endpoint does not have connectivity with Bitdefender Cloud Services
Product general issues (high verbosity logging)
Reproduce a generic reported issue with verbose logging.
Endpoint Detection and Response(EDR)
Incidents are not created
Incidents are false positive
Incidents are false negative
Incidents are missing data
Incidents contain incorrect data
For Debug session duration, choose the time interval after which the debug session automatically ends.
Note
It is recommended to manually stop the session using the Finish session option, right after you reproduce the issue.
In the Logs Storage section, choose one or both storage locations.
You can use the option Save logs also on target endpoint to save a copy of the logs archive on the affected endpoint as a backup.
Fill in the necessary information (local path, credentials for the network share, path to the shared location) depending on the selected location.
Click the Begin session button.
Important
You can run only one troubleshooting process at a time (Gather endpoint logs / Debug session) on the affected endpoint.
Troubleshooting history
The Last activity section presents the troubleshooting activity on the affected computer. The table displays only the latest 10 troubleshooting events in reverse chronological order and automatically deletes activity older than 30 days.
The table displays the details for every troubleshooting process.
The process has main and intermediary statuses. Depending on the customized settings, you can have the following status, where you are required to take action:
In progress (Ready to reproduce the issue) – access the affected endpoint manually or remotely and reproduce the issue.
You have several options to stop a troubleshooting process, as follows:
Finish session: ends the debug session and the gathering process on the endpoint while saving all the collected data to the specified storage location.
It is recommended to use this option right after you reproduced the issue.
Cancel: this option cancels the process and no logs are collected.
Use this option when you do not want to collect any logs from the endpoint.
Force Stop: forcefully stops the troubleshooting process.
Use this option when cancelling the session takes too long or the endpoint is unresponsive and you will be able to start a new session in a few minutes.
Important
To make sure the console displays the latest information use the Refresh button at the upper right side of the Troubleshooting page.
For more details about a specific event, click the event name from the table.
Users tab
This tab displays information about the users who logged into the computer, and contains the following elements:
Last update: shows when the information in this tab was last updated.
Refresh button: refreshes the data on the page.
A list that shows the following information:
Username: a list of the users who logged into the computer.
Last login method: shows whether the user logged in locally or remotely (via an RDP or SSH connection).
Last login time: shows the last time the user logged in.
Tip
You can use the filters available in each column header to search and refine the information displayed. For Last login time, use the two calendars to mark the beginning and the end of the time frame you are interested in.
Note
Each property in this window which is generating security issues is marked with the  icon. Check the icon's tooltip to find out more details. Further local investigations may be needed.
Viewing virtual machine details
You can obtain detailed information about each virtual machine from the Network page, as follows:
Checking the Network page
Checking the Information window
Checking the Network page
To find out details about a virtual machine, check the information available in the right-side pane table from the Network page.
You can add or remove columns with virtual machine information by clicking the Columns button at the upper-right side of the pane.
Log in to GravityZone Control Center.
Go to the Network page from the left side menu.
Choose Virtual Machines from the views selector.
Select the group that you want from the left-side pane.
All virtual machines available in the selected group are displayed in the right-side pane table.
You can easily identify the virtual machine status by checking the corresponding icon. For detailed information, refer to Checking the virtual machines status.
Check the information displayed on table columns for each virtual machine.
Use the header row to search as you type for specific virtual machines, according to the available criteria:
Name: virtual machine name.
FQDN: fully qualified domain name.
OS: operating system installed on the virtual machine.
IP: virtual machine's IP address.
Last seen: date and time when the virtual machine has last been seen online.
Note
It is important to monitor the Last Seen field as long inactivity periods might indicate a communication issue or a disconnected virtual machine.
Label: a custom string with additional information about the endpoint. You can add a label in the virtual machine's Information window and then use it in searches.
Policy: the policy applied to the virtual machine, with a link for viewing or changing the policy settings.
Checking the Information window
In the right-side pane of the Network page, click the name of the virtual machine you are interested in to display the Information window. This window displays only the data available for the selected virtual machine, grouped under several tabs.
Find hereafter the exhaustive list of information you may find in the Information window, according to the machine type (virtual machine, Security Server instance) and its specific security information.
General tab
General virtual machine information, such as name, FQDN information, IP address, operating system, infrastructure, parent group and current connection status.
In this section you can assign the virtual machine with a label. You will be able to quickly find virtual machines with the same label and take actions on them, no matter where they are located in the network. For more information about filtering virtual machine, refer to Sorting, filtering and searching for virtual machines.
Protection layers information, including the list of security technologies acquired with your GravityZone solution and their license status, which can be:
Available / Active – the license key for this protection layer is active on the virtual machine.
Expired – the license key for this protection layer is expired.
Pending – the license key is not confirmed yet.
Note
Additional information on the protection layers is available in the Protection tab.
Relay Connection: the name, IP and label of the relay to which the virtual machine is connected, if the case.
Protection tab
This tab contains details about each protection layer licensed on the endpoint. Details refer to:
Security agent information like product name and version, scanning engines configuration and update status.
Security status for each protection layer. This status appears at the right side of the protection layer's name:
Secure, when there are no security issues reported on the endpoints applied with the protection layer.
Vulnerable, when there are security issues reported on the endpoints applied with the protection layer. For more details, refer to Security Status.
Associated Security Server. Each assigned Security Server is displayed in case of agentless deployments or when scanning engines of the security agents are set to use remote scan. Security Server information helps you identify the virtual appliance and get its update status.
NSX related information, such as virus tag status and the security group to which the virtual machine belongs. If a security tag has been applied, it informs you that the machine is infected. Otherwise, either the machine is clean or security tags are not being used.
The protection modules status. You can easily view which protection modules have been installed on the endpoint and also the status of available modules (On / Off) set via the applied policy.
A quick overview regarding the modules activity and malware reporting in the current day.
Click the
View link to access the report options and then generate the report. For more information, refer to Creating ReportsInformation regarding the Sandbox Analyzer protection layer:
Sandbox Analyzer usage status on the virtual machine, displayed at the right side of the window:
Active: Sandbox Analyzer is licensed (available) and enabled via policy on the virtual machine.
Inactive: Sandbox Analyzer is licensed (available) but not enabled via policy on the virtual machine.
Name of the agent that acts as feeding sensor.
Module status on the virtual machine:
On - Sandbox Analyzer is enabled on the virtual machine via policy.
Off - Sandbox Analyzer is not enabled on the virtual machine via policy.
Threat detections in the last week by clicking the
View link to access the report.
Information regarding the Encryption module, such as:
Detected volumes (mentioning the boot drive).
Encryption status for each volume (which can be Encrypted, Encryption in progress, Decryption in progress, Unencrypted, Locked or Paused).
Click the Recovery link to retrieve the recovery key for the associated encrypted volume. For details about retrieving the recovery keys, refer to Using Recovery Manager for Encrypted Volumes.
Information on the Storage Protection module, in case the endpoint is a Security Server. Details refer to:
Service status:
N/A – Storage Protection is licensed, but the service is not configured yet.
Enabled – the service is enabled in the policy and functioning.
Disabled – the service is not functioning either because it has been disabled from the policy or the license key has expired.
List of the storage devices that have been scanned during the past month, with these details:
Storage device name
Storage device IP
Storage device type
The date and time of the last communication between the storage device and Security Server.
Policy tab
A virtual machine can be applied with one or more policies, but only one policy can be active at a time. The Policy tab displays information about all policies that apply to the virtual machine.
The active policy name. Click the policy name to open the policy template and view its settings.
The active policy type, which can be:
Device: when the policy is manually assigned to the virtual machine by the network administrator.
Location: a rule-based policy automatically assigned to the virtual machine if the virtual machine's network settings match the given conditions of an existing assignment rule.
User: a rule-based policy automatically assigned to the endpoint if it matches the Active Directory target specified in an existing assignment rule.
For example, a machine can have assigned two user-aware policies, one for administrators and one for other employees. Each policy becomes active when the user with the apropriate privileges logs in.
External (NSX): when the policy is defined in the VMware NSX environment.
The active policy assignment type, which can be:
Direct: when the policy is directly applied to the virtual machine.
Inherited: when the virtual machine inherits the policy from a parent group.
Applicable policies: displays the list of policies linked to existing assignment rules. These policies may apply to the virtual machine when it matches the given conditions of the linked assignment rules.
For more information regarding policies, refer to Managing Policies.
Relay tab
The Relay tab is available only for virtual machines with relay role. This tab displays information about the endpoints connected to the current relay, such as name, IP and label.
Scan Logs tab
The Scan logs tab displays detailed information about all scan tasks performed on the virtual machine.
Logs are grouped by protection layer and you can choose from the drop-down menu for which layer to display logs.
Click the scan task you are interested in and the log will open in a new page of the browser.
When many scan logs are available, they may span through several pages. To move through the pages, use the navigation options at the bottom of the table. If there are too many entries, you can use the filter options available at the top of the table.
Viewing container details
You can obtain detailed information about each container from the Network page, as follows:
Checking the Network page
To find out details about a container or a container host, check the information available in the right-side pane table from the Network page.
You can add or remove columns with container information by clicking the Columns button at the upper-right side of the pane.
Log in to GravityZone Control Center.
Go to the Network page from the left side menu.
Choose Cloud Workloads from the views selector.
Select the group that you want from the left-side pane.
All container hosts available in the selected group are displayed in the right-side pane table.
Click on a specific container host to display all available containers managed by that specific host.
You can easily identify the container and container host status by checking the corresponding icon. For detailed information, refer to Checking the container status.
Check the information displayed on table columns for each container. To filter out which columns are displayed, click the
Columns button at the upper right side of the screen.Use the header row to search for specific containers or container hosts. referred to collectively as endpoints, according to the available criteria:
Name: endpoint name.
FQDN: fully qualified domain name.
OS version: operating system version installed on the endpoint.
OS type: operating system type installed on the endpoint.
IP: endpoint's IP address.
Last Seen: date and time when the endpoint has last been seen online.
Note
It is important to monitor the Last Seen field as long inactivity periods might indicate a communication issue or a disconnected container.
Label: a custom string with additional information about the endpoint. You can add a label in the container's Information window and then use it in searches.
Policy: the policy applied to the endpoint, with a link for viewing or changing the policy settings.
Endpoint type: the type of endpoint (computer, virtual machine, container or mobile device).
Users - last user that accessed the device.
Note
Applies only to end-user devices.
Company: the company where the endpoint is located.
Container ID - the ID of the container.
Container image name - name of the container image.
Checking the Information window
In the right-side pane of the Network page, click the name of the container you are interested in to display the Information window. This window displays only the data available for the selected container, grouped under several tabs.
Find hereafter the exhaustive list of information you may find in the Information window, according to the machine type and its specific security information.
General tab
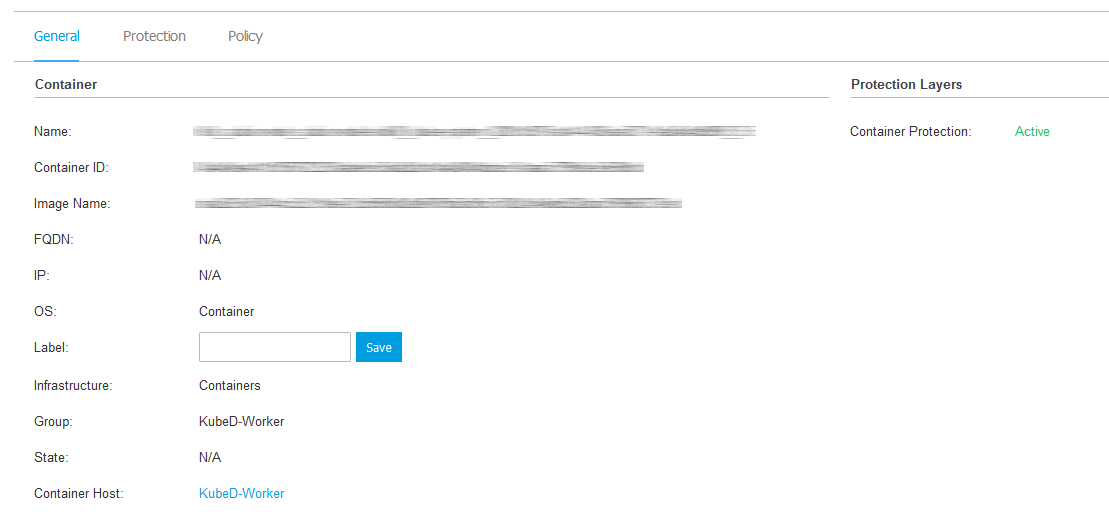
General container information, such as name, FQDN information, IP address, operating system, infrastructure, parent group and current connection status.
In this section you can assign the container with a label. You will be able to quickly find containers with the same label and take actions on them, no matter where they are located in the network. For more information about filtering containers, refer to Sorting, filtering, and searching for containers.
Protection layers information, including the list of security technologies acquired with your GravityZone solution and their license status, which can be:
Available / Active – the license key for this protection layer is active on the container.
Expired – the license key for this protection layer is expired.
Pending – the license key is not confirmed yet.
Note
Additional information on the protection layers is available in the Protection tab.
Protection tab
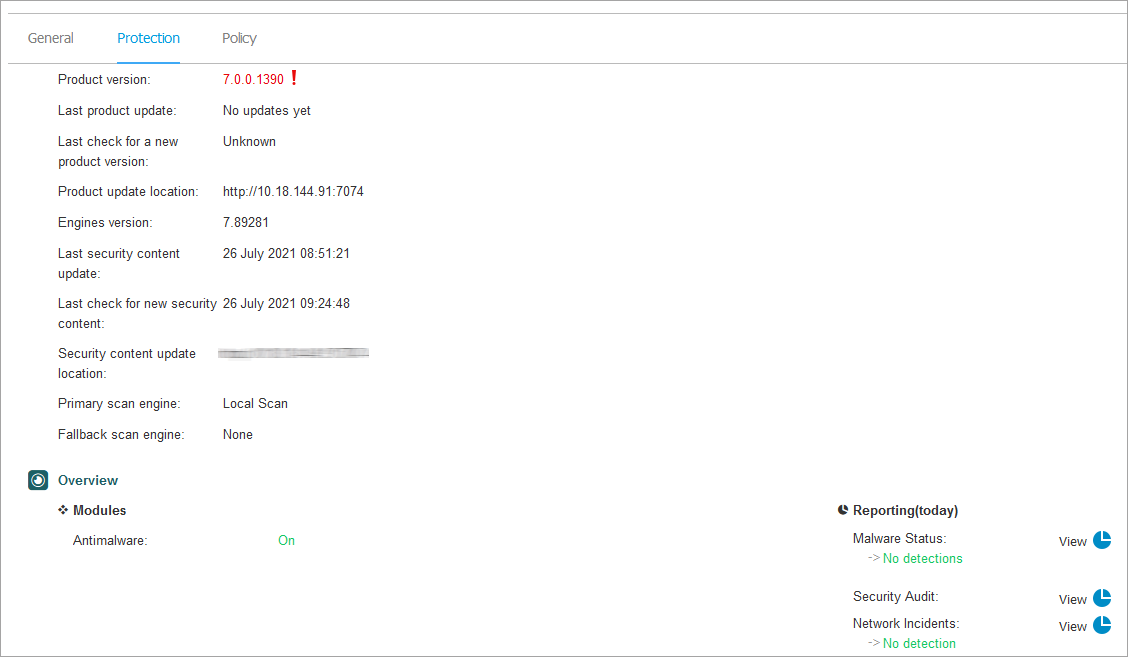
This tab contains details about each protection layer licensed on the endpoint. Details refer to:
Security agent information, including protection type, product version, update related information, engine version, security content details and scan engine information.
Security status for each protection layer. This status appears at the right side of the protection layer's name:
Secure, when there are no security issues reported on the endpoints applied with the protection layer.
Vulnerable, when there are security issues reported on the endpoints applied with the protection layer. For more details, refer to Security Status.
NSX related information, such as virus tag status and the security group to which the container belongs. If a security tag has been applied, it informs you that the machine is infected. Otherwise, either the machine is clean or security tags are not being used.
The protection modules status. You can easily view which protection modules have been installed on the endpoint and also the status of available modules (On / Off) set via the applied policy.
A quick overview regarding the modules activity and malware reporting in the current day.
Click the
View link to access the report options and then generate the report. For more information, refer to Creating Reports
Policy tab
A container can be applied with one or more policies, but only one policy can be active at a time. The Policy tab displays information about all policies that apply to the container.
The active policy name. Click the policy name to open the policy template and view its settings.
The active policy type, which can be:
Device: when the policy is manually assigned to the container by the network administrator.
Location: a rule-based policy automatically assigned to the container if the container's network settings match the given conditions of an existing assignment rule.
User: a rule-based policy automatically assigned to the endpoint if it matches the Active Directory target specified in an existing assignment rule.
For example, a machine can have assigned two user-aware policies, one for administrators and one for other employees. Each policy becomes active when the user with the appropriate privileges logs in.
External (NSX): when the policy is defined in the VMware NSX environment.
The active policy assignment type, which can be:
Direct: when the policy is directly applied to the container.
Inherited: when the container inherits the policy from a parent group.
Applicable policies: displays the list of policies linked to existing assignment rules. These policies may apply to the container when it matches the given conditions of the linked assignment rules.
For more information regarding policies, refer to Managing Policies.
Checking User and Mobile Devices Details
You can obtain detailed information about each user and mobile device from the Network page.
Checking User Details
Log in to GravityZone Control Center.
Go to the Network page from the left side menu.
Choose Mobile Devices from the views selector.
Select the desired group in the left-side pane.
Click the Filters menu located at the upper side of the table, go to the View tab and select Users.
To display users recursively, go to the Depth tab and select All items recursively.
Click Save.
All users in the selected group are displayed in the table.
Check the information displayed in the table columns for each user:
Name.
The user name.
Devices.
The number of devices attached to user.
Click the number to switch to the Devices view and display the corresponding devices only.
Compliance.
The ratio of compliant devices to total devices attached to user.
Click the first value to switch to the Devices view and display the compliant devices only.
Click the name of the user you are interested in.
A configuration window appears, where you can view and edit the user's name and email address.
Checking Device Details
Log in to GravityZone Control Center.
Go to the Network page from the left side menu.
Choose Mobile Devices from the start.gui.service views selector.
Select the desired group in the left-side pane.
Click the Filters menu located at the upper side of the table, go to the View tab and select Devices.
Click Save.
All devices belonging to users in the selected group are displayed in the table.
Check the information displayed in the table columns for each device:
Name.
The device name.
User.
The name of the user owning the corresponding device.
OS.
The operating system of the corresponding device.
Click the name of a device for more details.
The Mobile Device Details window appears, where you can check the following information grouped under Overview and Details tabs:
General.
Name.
The name specified when adding the device in Control Center.
User.
The device owner's name.
Group.
The mobile device's parent group in the network inventory.
OS.
The mobile device's operating system.
Ownership.
The mobile device ownership type (enterprise or personal).
Security.
Client Version.
The version of GravityZone Mobile Client application installed on the device, only detected after enrollment.
Policy.
The policy currently assigned to the mobile device.
Click the policy name to go to the corresponding Policy page and check the security settings.
Important
By default, only the user who created the policy can modify it. To change that, the policy owner must check the option Allow other users to change this policy from the policy’s Details page.
The changes made to a policy will affect all devices assigned with the corresponding policy.
For more information, refer to Assigning Policies.
License status. View license information for the corresponding device.
Compliance status. The compliance status is available for managed mobile devices. A mobile device can be Compliant or Not compliant.
Note
For not compliant mobile devices, a notification icon
is displayed. Check the icon's tooltip to view the non-compliance reason.For more details regarding mobile devices compliance, refer to Compliance .
Malware Activity (last 24h). A quick overview regarding the number of malware detections for the corresponding device in the current day.
Lock Password.
A unique password automatically generated at device enrollment, which is used for remotely locking the device (for Android devices only).
Encryption status. Some of 3.0 Android devices or newer support the device encryption feature. Check the encryption status in the device details page to find out if the corresponding device supports the encryption feature. If the encryption has been required by policy on the device, you can also view the encryption activation status.
Activation Details
Activation Code.
The unique activation token assigned to the device.
The communication server appliance address.
QR Code.
The unique QR Code containing the activation token and the communication server appliance address.
Hardware. You can view here the device hardware information, available only for managed (activated) devices. Hardware information is checked every 12 hours and updated if changes occur.
Network. You can view here network connectivity information, available only for managed (activated) devices.