Investigating Incidents
The Incidents section helps you filter, investigate and take actions on all security events detected by Incidents Sensor over a specific time interval.
This section contains the following features:
Incidents: view and investigate incidents.
Blocklist: manage blocked files from incidents.
Custom rules: create custom rules for exclusions or detections
Note
Availability and functioning of these features may differ depending on the license included in your current plan.
The Incidents page
The Incidents page provides a highly customizable grid that displays a list of EDR incidents generated for your managed companies in the last 90 days.
Note
To receive incidents from the EDR sensor module, or from prevention modules such as Antimalware, Advanced Threat Control, Hyper Detect, or Anti-Exploit, you need to have the Incidents server role installed.
Incidents related to deleted endpoints are also displayed on this page for all users with the Manage Solution right. In the incident details, these endpoints are marked as unmanaged.
This page contains the following areas:
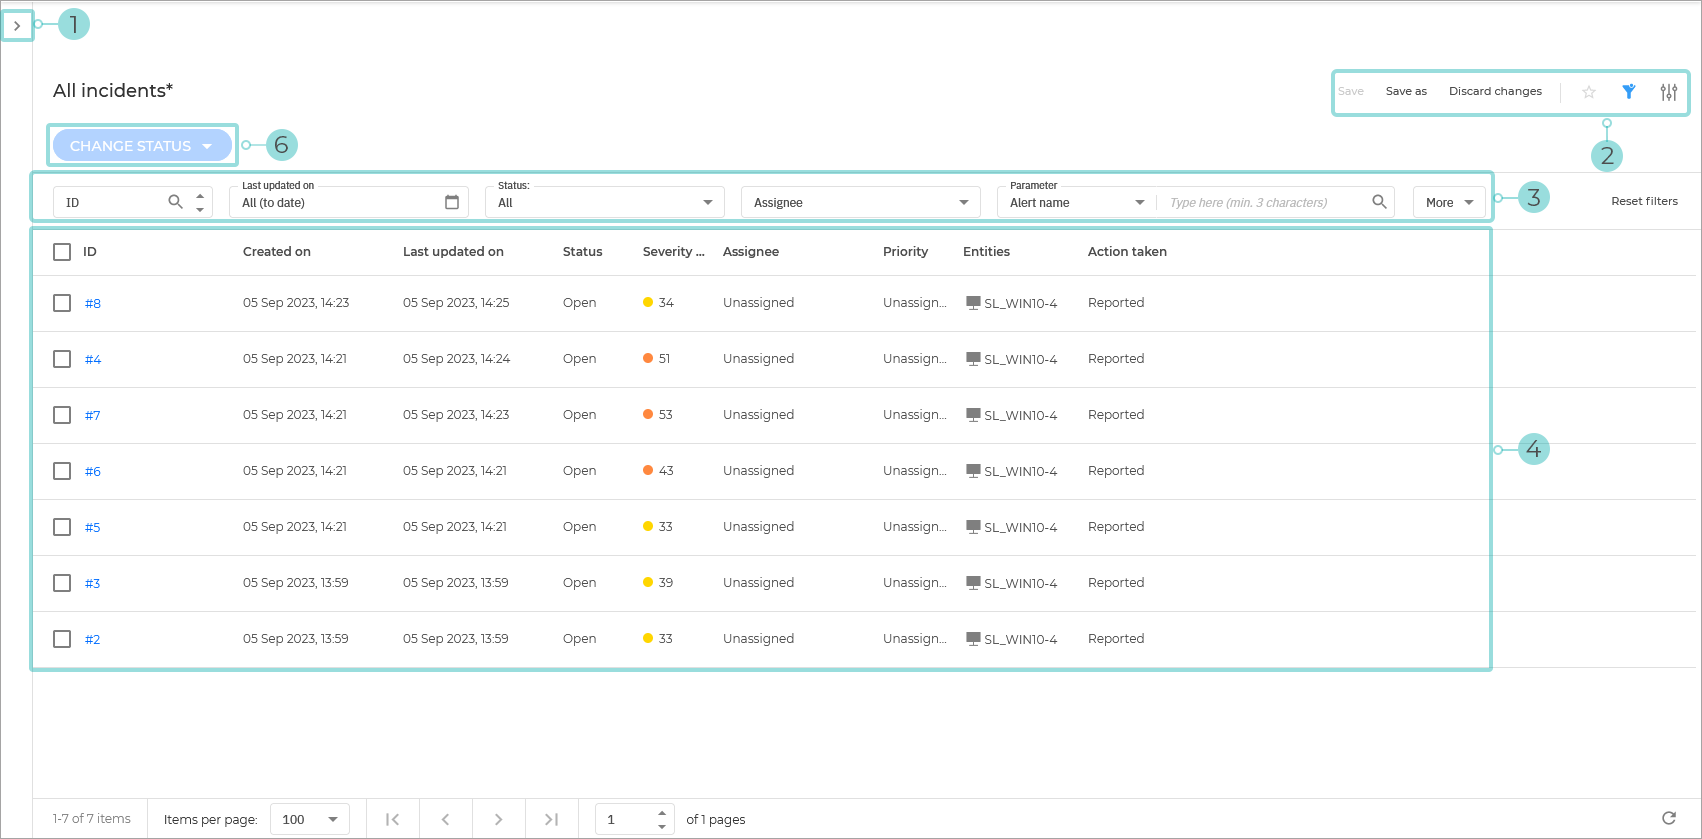
The Smart views. This feature allows you to customize, save, and switch between different loadouts of the Incidents page.
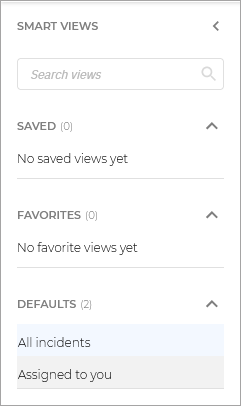
The panel has the following sections:
Search views - Use this search field to filter out the views displayed in the sections below, by name.
Saved - This section displays a list of all your saved views that have not been marked as favorites.
Favorites - All views marked as favorites are displayed under this section.
Defaults - This section displays the views that are available by default:
All incidents
Assigned to you
For any view in the Saved or Favorites category, you can click
 to Rename or Delete the view.
The View options menu. This section provides you with multiple functions for working with views:
Save: Use this option to save changes you make to a saved view.
Save as: allows you to save a modified view under a different name.
Discard changes: reverts the saved view to its original state.
Add to favorites: adds the view to the Favorites category.
Export view: exports your incidents grid as a CSV file.
The file includes the same columns as those displayed in your current view.
Important
Up to 10,000 incidents can be exported at a time. We recommend adjusting the search options if your dataset exceeds this number.
Show or hide filters: hides or displays the filters menu.
Open Settings: displays the Settings panel.
You can use this panel to customize what columns are displayed in the view and enable or disable the Compact view.
The Filters section. You can use these options to customize the incidents that are displayed in the table below.
The following filters are currently available:
Filtering option
Details
ID
Type in a complete ID number for the incident you are looking for.
Only incidents with matching IDs are displayed.
Created on
Select a specific date range.
Only incidents that were created in that time period are displayed.
Last updated on
Select a specific date range.
Only incidents that were last updated in that time period are displayed.
Status
Select one or more of the following statuses:
All - Displays all incidents, regardless of their status.
Open - Displays incidents that have been recently generated and are yet to be investigated.
Investigating - Displays incidents currently under investigation.
Closed: False positive - Displays incidents that were investigated and confirmed to be false alarms.
Closed: Confirmed incident - Displays incidents that were confirmed as valid and are now closed following investigation.
Closed: Reviewed by MDR SOC - Displays incidents that were reviewed and closed by the MDR SOC.
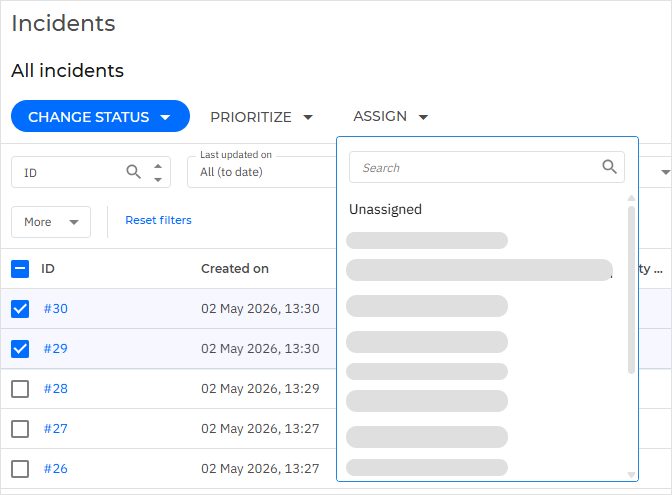
Assignee
Select a GravityZone user from the list.
Only incidents assigned to the selected user are displayed.
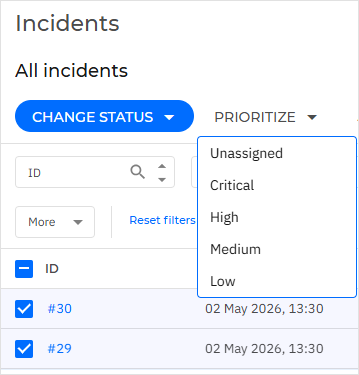
Priority
Select one or more of the available priorities:
All
Unassigned
Low
Medium
High
Critical
Only incidents with the selected priorities are displayed.
Severity score
Drag the two toggles in the slide bar or type in specific values to specify a range for the Severity score.
The Severity score is a number between 10 and 100, indicating how potentially dangerous a security event is. The higher the score, the more certain the event is dangerous. It provides context based on the attack indicators and ATT&CK Techniques, if applicable.
Only incidents with severity scores between the selected values are displayed.
Entities
Select one or more network entities from the available list. Only incidents with entities that exactly match at least one selected value are displayed.
Tip
The options list is dynamically generated from entities found in your incidents. To add a custom entity as a reusable filter:
Enter the desired value.
Select its checkbox.
Click Apply.
When reopening the filter, the custom value is visible in the list. It is temporary and can be used to create smart views for monitoring future incidents involving that entity. The value is cleared on page refresh, when applying filters that exclude it, or when navigating away, and must be added again if needed.
Actions taken
Select one or more of the following options:
All
Reported
Blocked
Partially blocked
Only incidents with the selected actions assigned are displayed.
Parameter
Select between the available parameters:
Alert name - The name of the alert involved in the incident.
Att&ck technique - The name of the Mitre technique used in the incident.
Att&ck technique ID - The ID of the Mitre technique used in the attack.
Att&ck sub-technique - The name of the Mitre subtechnique used in the attack.
Att&ck sub-technique ID - The ID of the Mitre subtechnique ID used in the attack.
IP - The IP address involved in the incident.
MD5 - The md5 hash of the file involved in the incident.
SHA256 - The sha256 hash of the file involved in the incident.
Node name - The name of the node involved in the incident.
Username - The username involved in the incident.
File name - The name of the file involved in the incident.
File path - The path of a file involved in the incident.
URL - The URL involved in the incident.
Process name - The name of the process involved in the incident.
Process path - The path of the process involved in the incident.
Process PID - The identifier of the process involved in the incident.
Registry key - The registry key involved in the incident.
Detection Rule ID - The ID of the Custom detection rule.
FQDN - The Fully Qualified Domain Name associated with at least one node involved in the incident.
This filter performs partial (substring) matching and returns incidents containing values that include the specified character sequence.
The Incidents table. The table displays all incidents not older than 90 days that conform to the currently applied filter.
The information available for each incident is displayed under the following columns:
ID - The ID of the incident.
Click on the incident number to display additional information regarding the incident.
Select the checkbox next to each incident number to include the incident when performing a Change status bulk action.
Created on - The date when the incident was created
Last updated on - The date when the incident was last updated.
Status - The status of the incident.
Assignee - The security analyst assigned to the incident.
Priority - The priority assigned to the incident.
Severity score - The severity score assigned to the incident.
Entities - A list of entities involved in the incident.
Click on any of the entities to display the Entities panel.
Actions taken - The action taken after investigating the incident.
Note
More details regarding the information in each column are available type in the Filters section.
The Incident actions button. The button provides the following options:
Prioritize - Selecting this option opens a window where you can set the incident’s new priority and provide a comment explaining the reason for the update. The priority change is applied once you click Change.
Assign - Selecting this option opens a window where you can set the incident’s new assignee and provide a comment explaining the reason for the update. The assignee change is applied once you click Change.
The Change status button. Use this action to perform a bulk action on all selected incidents from the grid below.
A confirmation window is displayed.
You can use the Notes text box to comment on the reason for changing the incident status. The note will be added to the ones already added to the incident.
The Prioritize button. Use this action to assign a priority to all selected incidents from the grid below.
A confirmation window is displayed.

You can use the Notes text box to leave a comment on the reason for changing the priority. The note will be added to the ones already added to the incident.
The Assign button. Use this action to assign an analyst to all selected incidents from the grid below.
A confirmation window is displayed.
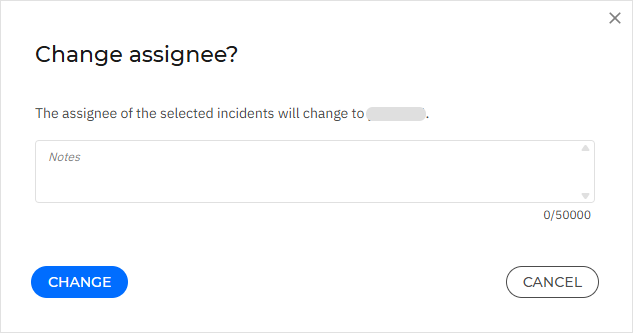
You can use the Notes text box to leave a comment on the reason for changing the assignee. The note will be added to the ones already added to the incident.
Managing incidents
In the Incidents page, you can perform the following actions:
View incident details
To display additional information regarding any specific incident, use the method below:
Display the incident details panel: Click anywhere on the row belonging to the incident you want to view (except the ID and Entities columns):
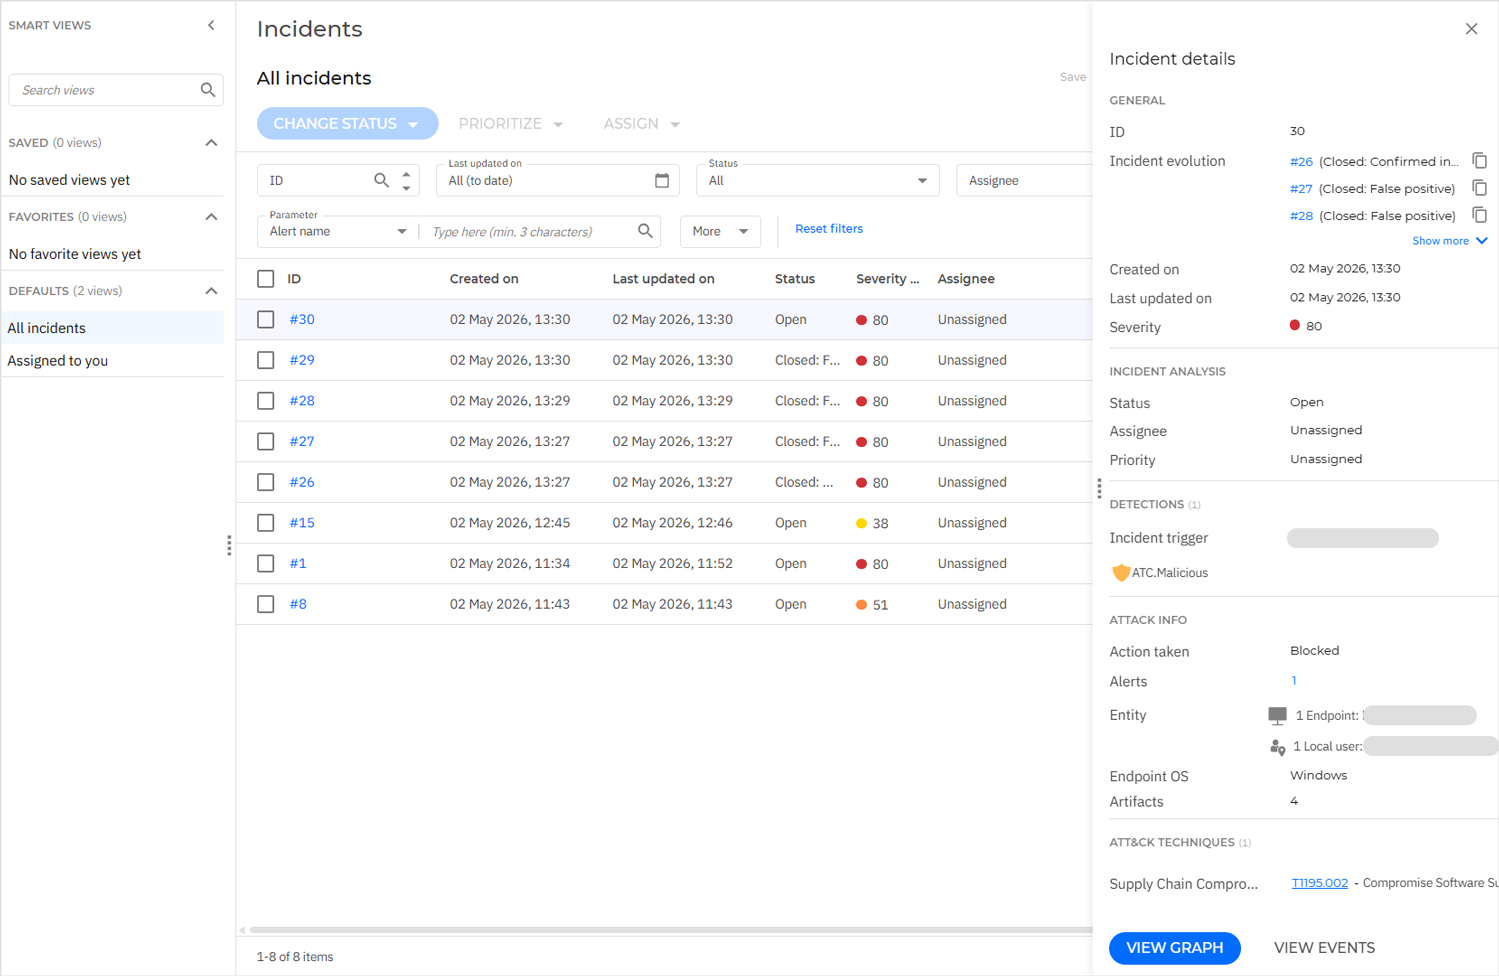
The incident details panel
The incident details panel provides a centralized view of all relevant information for a selected incident. It is structured into several sections for quick analysis and investigation:
General: Includes key identifiers such as the incident ID, the Incident evolution chain, and timestamps for creation and last update, along with severity details.
Important
The Incident evolution field is displayed only when the Create a separate incident when new activity is detected option is enabled in the Configuration > Miscellaneous tab, under the Incidents section.
In this case, a new incident is generated whenever new activity is detected on a closed incident. The newly created incident remains open and is continuously updated with related activity until it is closed. If further activity is detected after this incident is closed, another new incident is created. All related incidents generated through this process form the Incident evolution chain.
Incident analysis: Summarizes the current state of the incident, including its status, assigned user, and priority.
Attack info: Includes:
Actions taken
The number of associated alerts
Number of artifacts
The affected entities
The endpoint OS
ATT&CK techniques: Maps the incident to MITRE ATT&CK techniques, offering deeper insight into attacker behavior.
Detections: Provides a summary of the security events that contributed to the incident. Displays the Incident trigger along with the types of detections (for example, malicious URL, fraud, or phishing) associated with the incident.
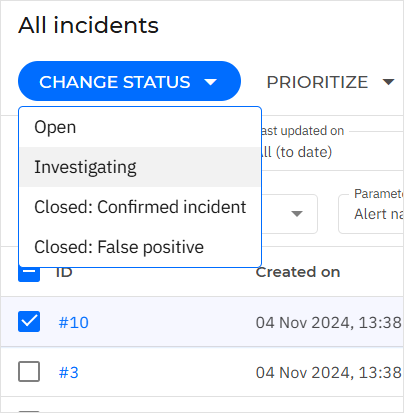
Changing the status of incidents
The investigation status helps you keep track of incidents that have already been investigated and marked as confirmed or false positive, incidents that are currently under investigation and open, or new incidents that have yet to be analyzed.
Follow these steps to change the status of one or multiple security events:
Select the checkboxes under the ID column of all the incidents you want to change the status for. Incidents will remain selected when you move between grid pages.
Tip
Clicking on the checkbox located in the table header row will select all the incidents displayed on the page.
Click the Change status button.
A list of available statuses is displayed:
Select one of the available statuses:
All - All incidents, regardless of their status.
Open - Incidents that have been recently generated and are yet to be investigated.
Investigating - Incidents currently under investigation.
Closed: False positive - Incidents that were investigated and confirmed to be false alarms.
Closed: Confirmed incident - Incidents that were confirmed as valid and are now closed following investigation.
Important
For incidents that belong to an Incident evolution chain, only the most recent incident can be reopened and reinvestigated.
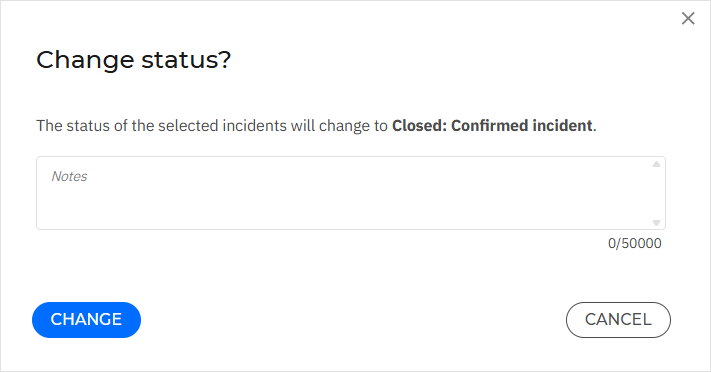
A confirmation window is displayed.
You can use the Notes text box to comment on the reason for changing the incident status. The note will be added to the ones already added to the incident.
Click Change to confirm the request.
Investigating an Endpoint Incident
The Endpoint Incidents tab displays all suspicious incidents detected at endpoint level, that require investigation and upon which no action was taken yet.
In the Endpoint incidents tab, identify the security event you want to analyze from the incidents grid.
Use the View Graph button in the incident card to open the Incident graph in a new page, or
Select a security event card to open its details panel for a quick look at the most important attack indicators of that incident.
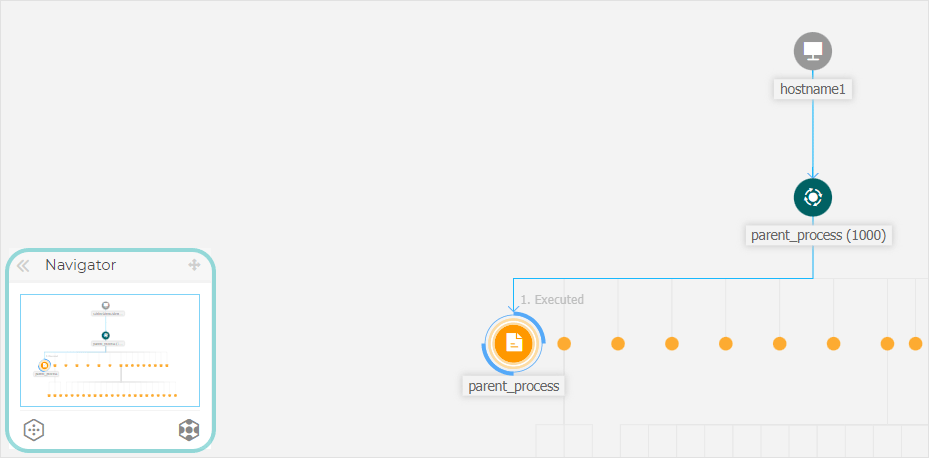
After opening the incident graph you can see sequence of events that led to triggering the incident, and provides options to take remediation actions.
By default, the graph highlights the Critical path of the incident, and the event that triggered the incident.
Start analyzing the information displayed in the details panel of the trigger node, to find what is the root cause of the incident.
In the panel you can find valuable info like the alerts detected on the trigger node, the date and time of the event, and command lines that were executed by the attacker.
If the situation allows it, select the Add to Sandbox button to detonate suspicious or malicious elements and see the Sandbox report to evaluate the damage they may have cause to your environment.
Tip
To make sure you did not miss anything, investigate the incident nodes on the same level as the trigger node.
You can continue to analyze the other elements constituting the critical path until you get a clear picture of what caused the incident.
If the threat is real take appropriate actions to mitigate it. Learn more about available actions in Node details.
If the threat is not real you can go to the Status menu at the top of the graph and set the status of the incident to False positive, and start investigating the next incident in the list.
Note
You can use the Notes clipboard to leave insights about the incident, to provide context in case other users reopen the incident.
When further investigation is needed, navigate to the Events tab to see all the raw events and alerts that were spawned as part of the incident under investigation.
Graph
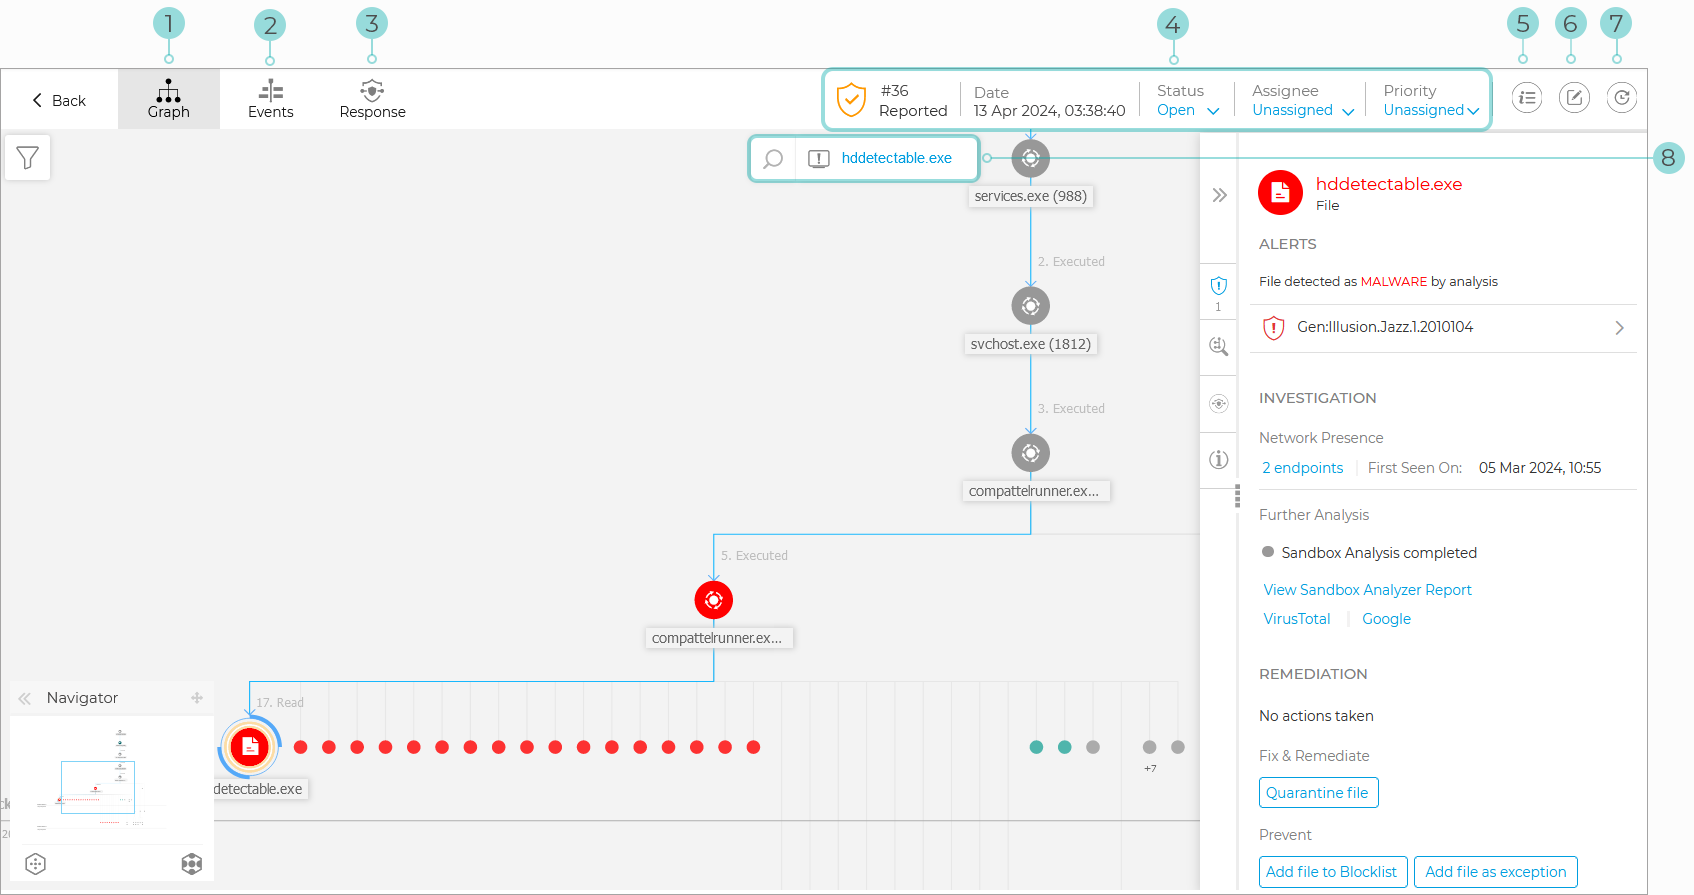
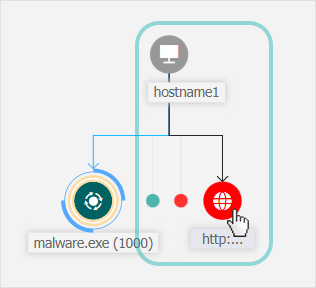
The Graph provides an interactive graphical representation of the investigated incident and its context, highlighting the sequence of elements directly involved in triggering it, known as the Critical path of the incident, as well as all the other elements involved, faded out by default.
The Graph includes filtering options that allow the customization of the incident graphic to improve visualization, and details panels with more information about each element, to facilitate the investigation of what happened in your environment.
Critical path
The Critical path is the sequence of linked security events that have led up to setting off an alert, starting from the point of entry in the network down to the event node that triggered the incident.
The critical path of the incident is highlighted by default in the graph, along with all consisting event nodes. The trigger node easily stands out from the rest of the elements in the graph, and its info panel is displayed by default alongside the incident graph, providing detailed trigger node information.
Trigger Node
Node Details panel with collapsible information sections
Minimized nodes, indirectly involved in the incident
Tip
Selecting any other element than the trigger node will no longer highlight the critical path, and show the path to origin instead, from the selected node to the start of the incident.
Security event nodes
This is what you need to know about security event nodes:
Each node represents a specific element involved in the investigated incident.
All nodes that make the critical path are shown by default in detail when you open the incident, while the other elements are faded out, to avoid cluttering the view.
Hovering over a node that is not part of the critical path will highlight it and show the path to the point of origin, without breaking the Critical Path.
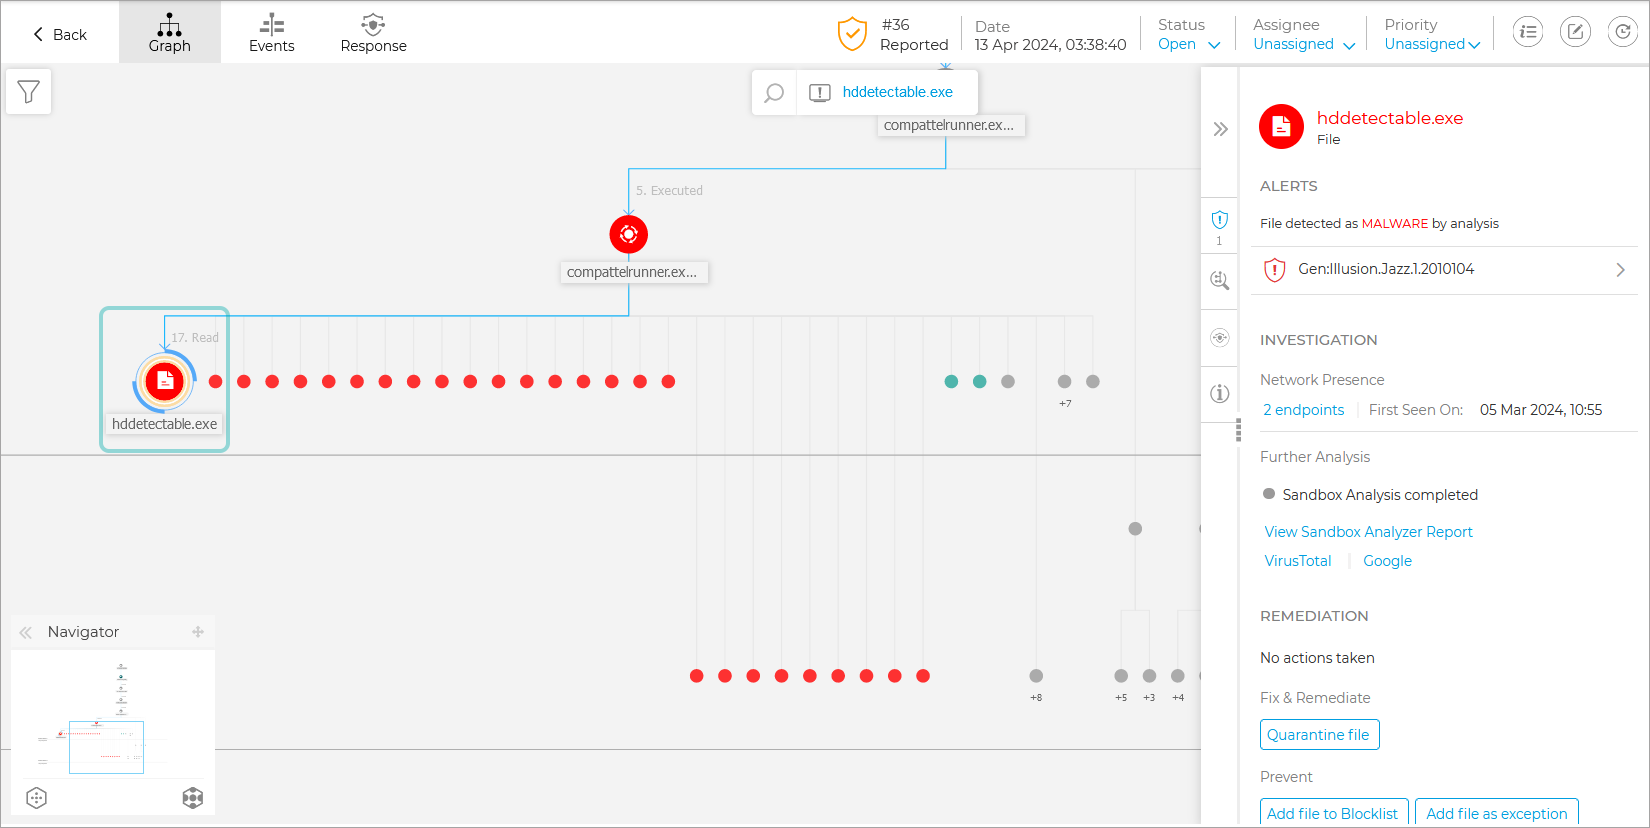
Three or more same action type event nodes spawning from a parent node are grouped into an expandable cluster-node.
Only nodes without child elements will be hidden from the incident graph when the cluster-node is collapsed.
Nodes where suspicious activity has been detected will not be added to the cluster-node.
Clicking a node will display the following details:
It will highlight in blue the path to the endpoint node along with all the other involved elements.
A side panel with expandable sections that provide detailed information of the selected node, alerts in case detections are triggered, available actions and recommendations.
Nodes are linked by arrow-lines indicating the course of actions that occurred on the endpoint during the incident. Each line is labeled with the action name and its chronological number.
The following elements of an incident can be represented as nodes:
Node type | Description |
|---|---|
Endpoint | Displays endpoint details and patch management status. |
Domain | Shows information about the domain host and its endpoints. |
Process | Shows details about the process role in the current incident, file information, process executions details, network presence and further investigation options. |
File | Shows details about the file role in the current incident, file information, network presence and further investigation options. |
Registry | Displays Registry information and the parent process details. |
Note
Learn more about node details here.
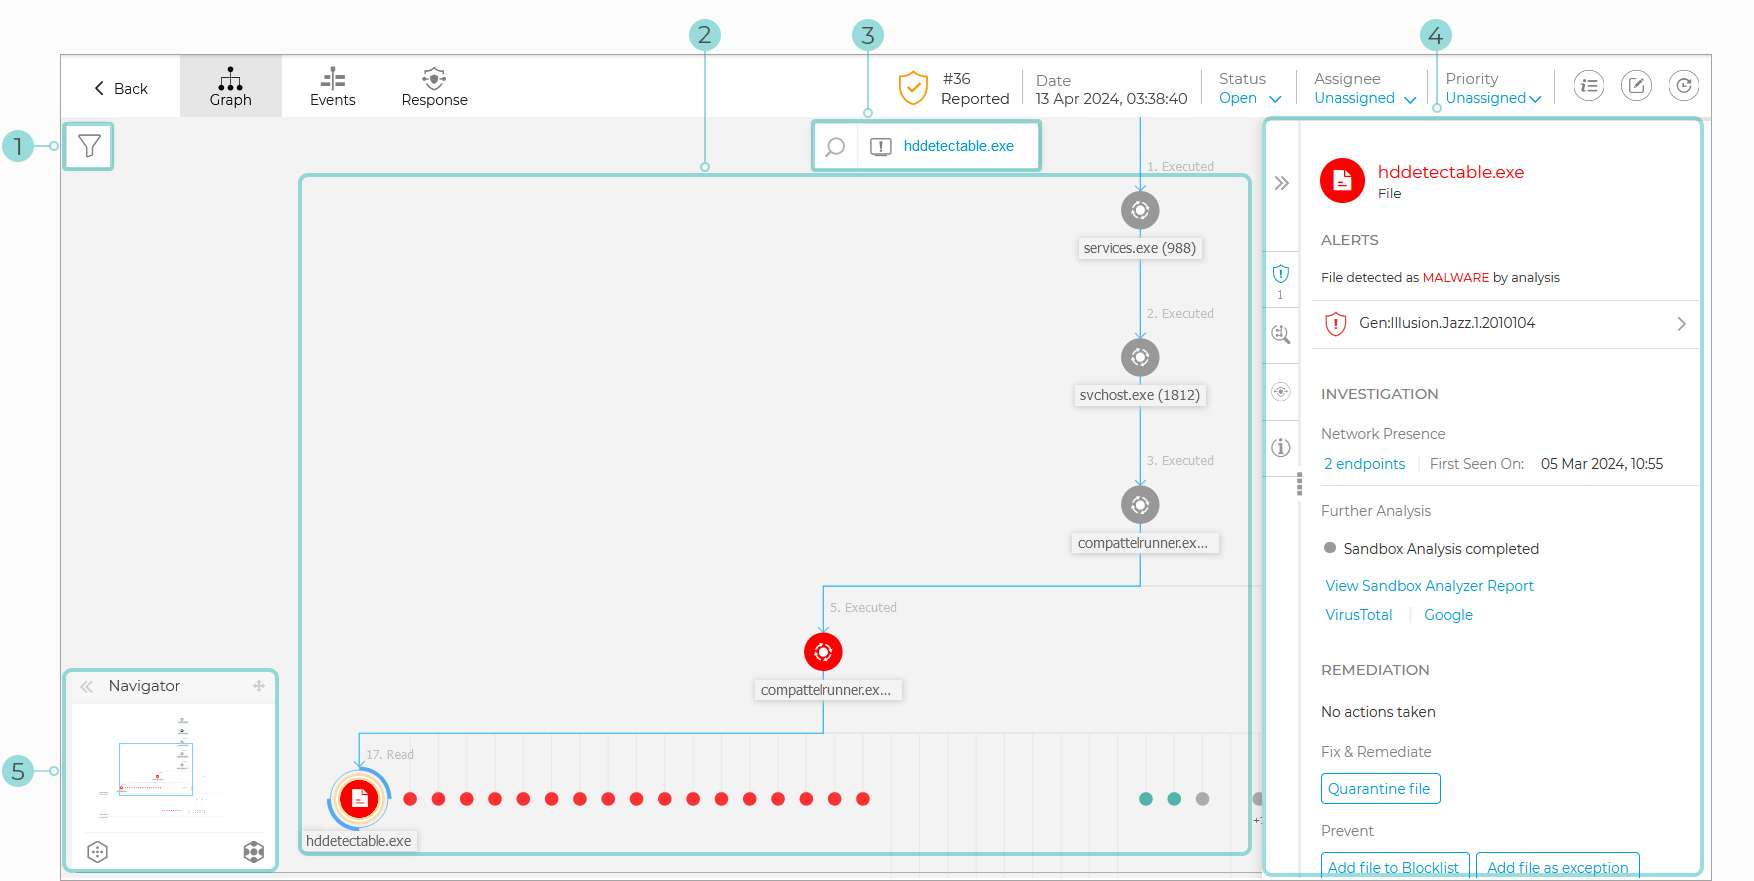
Filters
The Filters menu provides you with enhanced filtering capabilities, allowing full manipulation of the incident graphic, by highlighting the elements based either on their type or relevance, or by hiding them to make the incident more compact and easier to analyze.
Click an hold the  Drag icon to position the floating filters panel anywhere inside the incident graph.
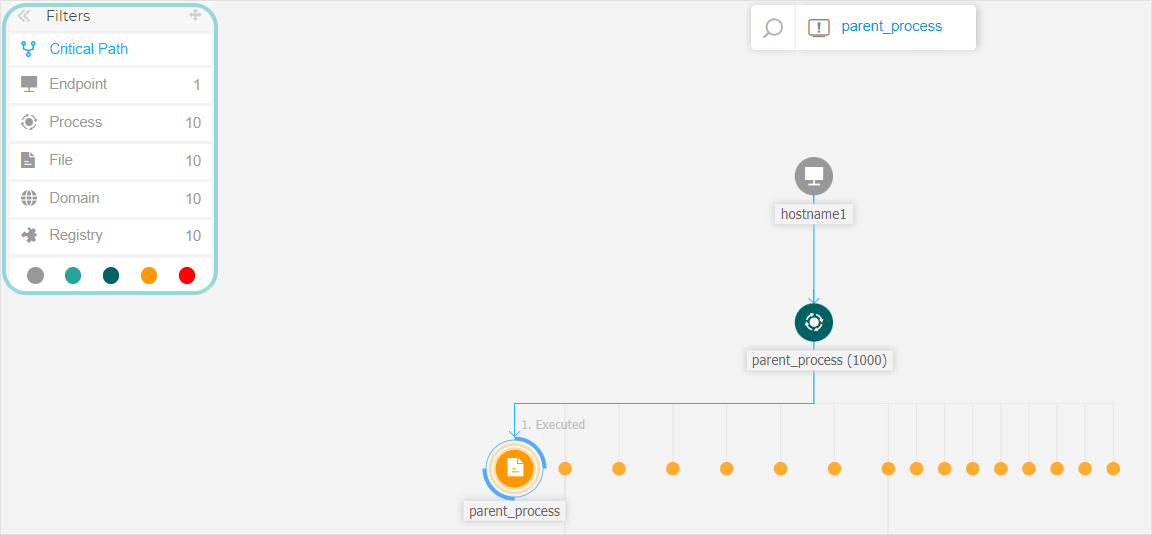
When selecting an element-type filter:
The incident graphic zooms out and highlights all the elements of the selected type, while the elements of different type are faded out.
It instantly opens a panel with the list of all the highlighted elements.
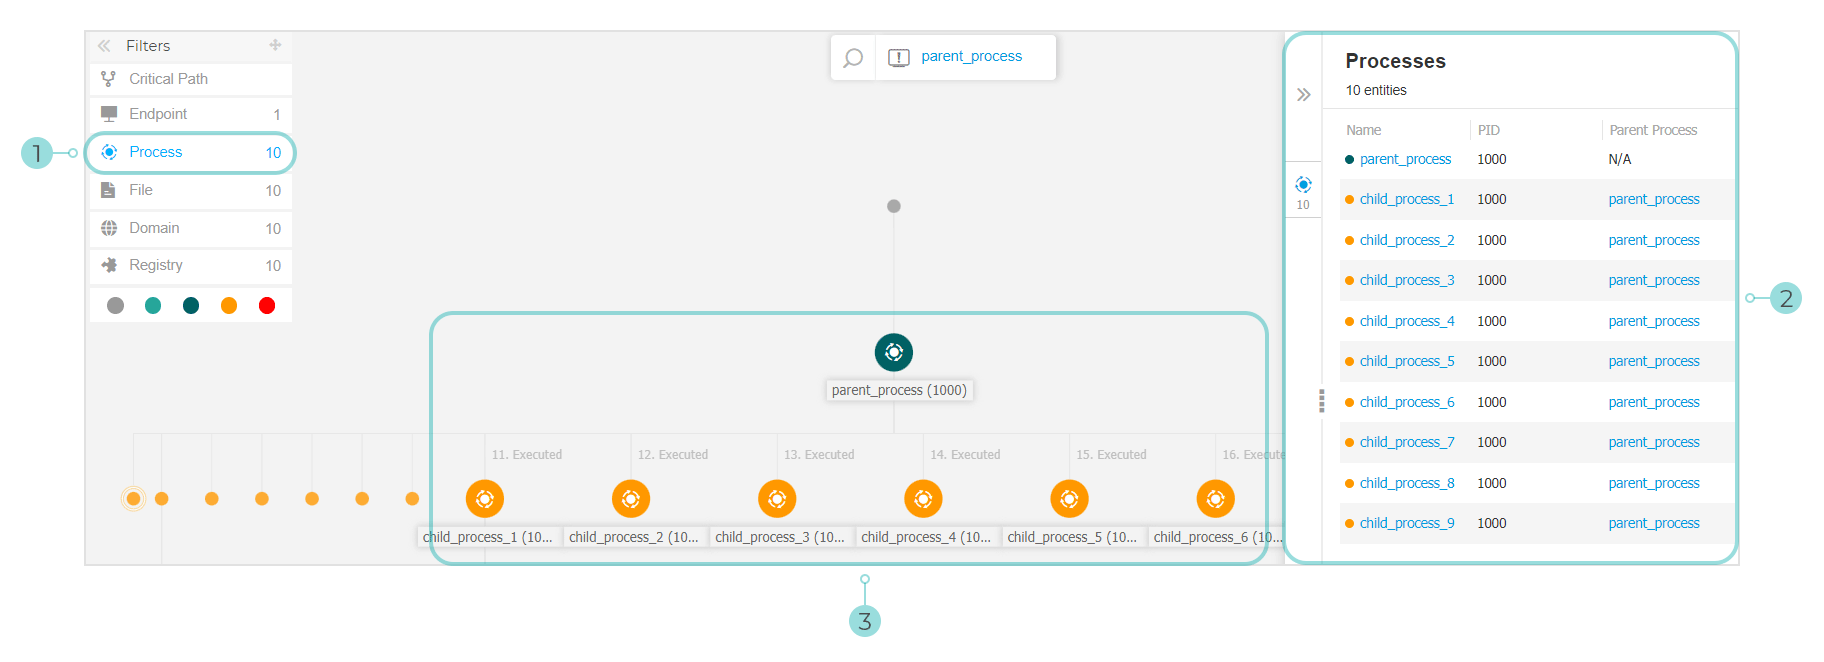
Note
Selecting an element from the displayed list will highlight it in the incident graphic, and open a details panel with information related to that element.
Only one filter can be applied at a time.
Filtering options include:
Critical path: It highlights the critical path of the incident of compromise.
Endpoint: It highlights the endpoints affected by the incident.
Process: It highlights all process-type nodes involved in the incident.
File: It highlights file-type nodes involved in the incident.
Domain: It highlights all domain-type nodes involved in the incident.
Registry: It highlights all registry-type nodes involved in the incident.
Element relevance: You can also filter elements by their importance inside the incident.
 Neutral node: Elements with no direct impact in the security incident.
 Important node: Elements with relevant role in the security incident.
 Origin node: Ground zero of the incident inside the network.
 Suspicious node: Elements with suspicious behavior, directly involved in the security incident.
 Malicious node: Elements that caused damage to your network.
You can also hide certain elements from the incident graph by clicking the Show/Hide button displayed when hovering over filters of the type: File, Domain, and Registry.
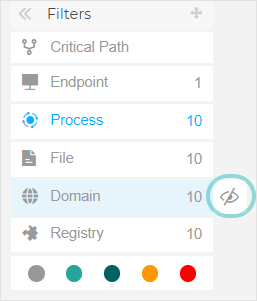
Hiding an element type redraws the incident graph by removing all corresponding elements, even if they are zoomed out, excepting the trigger node and nodes with child elements.
Navigator
The Navigator enables you to quickly move through the incident graph and explore all displayed elements by using the mini-map and the different levels of visualization. The Navigator is collapsed by default. When expanding it, the menu will display the miniaturized version of the entire incident map, and action buttons to adjust the level of visualization.
Click and hold the Drag icon to position the floating navigator panel anywhere inside the incident graph.
The Navigator makes it easy to adjust how you visualize the incident graph, through the use of the  Fewer details and
  More details actions.
Note
In situations when the incident the graph expands beyond screen limits, hold and drag the map selector to the desired incident map area.
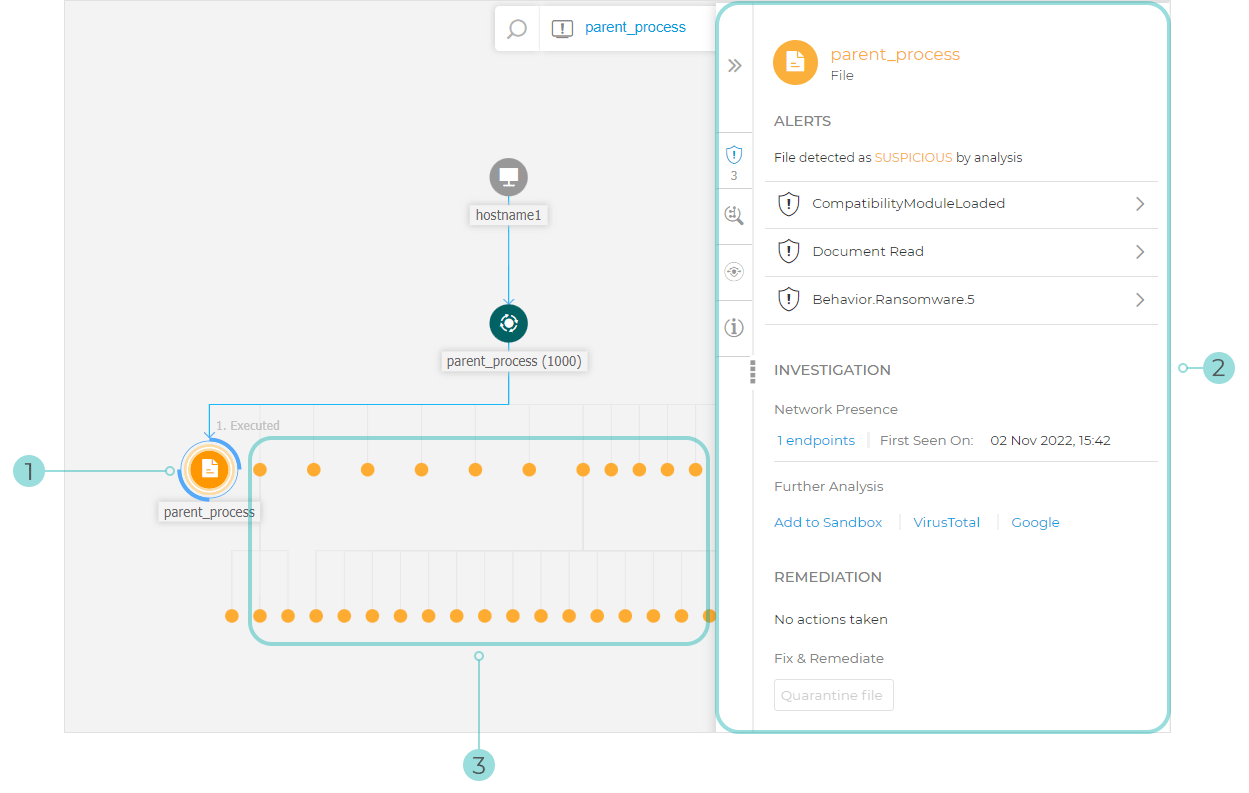
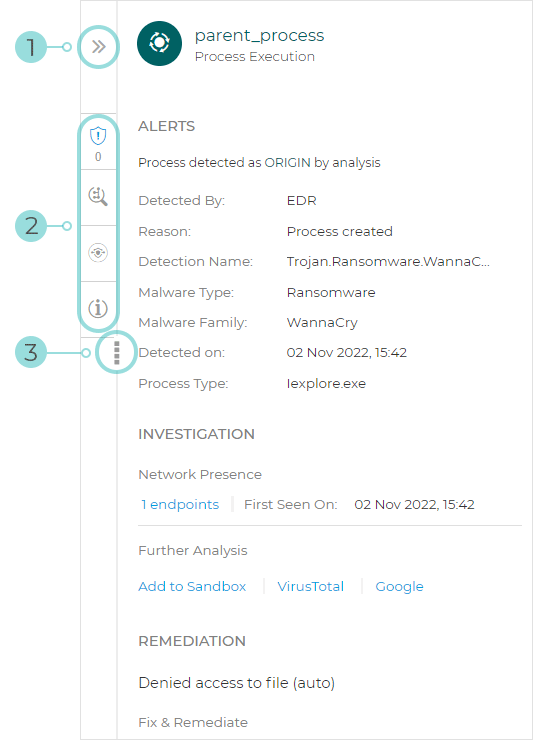
Node details
The Node details panel includes expandable sections with detailed information of the selected node, including preventive or remediation actions you can take to mitigate the incident, details on the type of detection and alerts detected on the node, network presence, process execution details, additional recommendations to manage the security event, or actions to further investigate the element.
To view this information and take actions within the panel, select a node within the security event map.
You can collapse the Node Details panel by clicking the Collapse button.
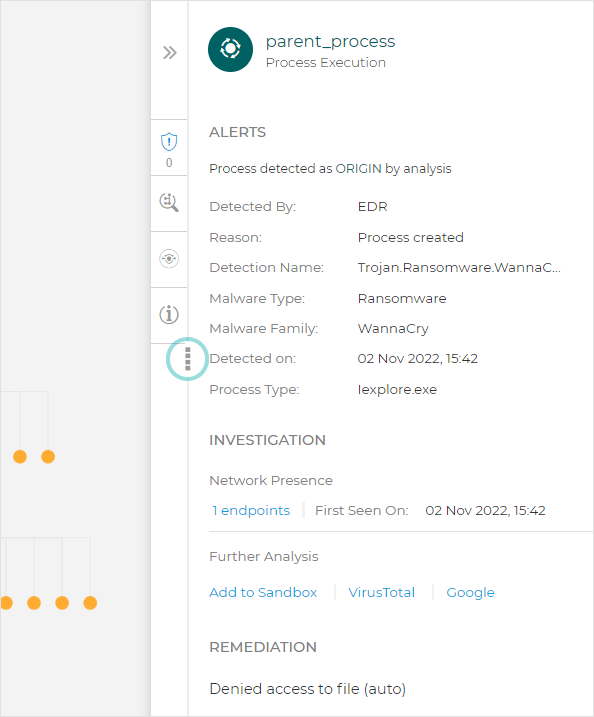
You can easily navigate the information displayed in the Node Details panel by clicking the icons pf each of the four major sections:
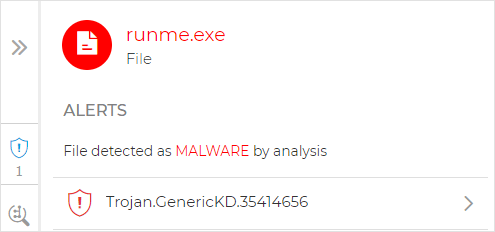
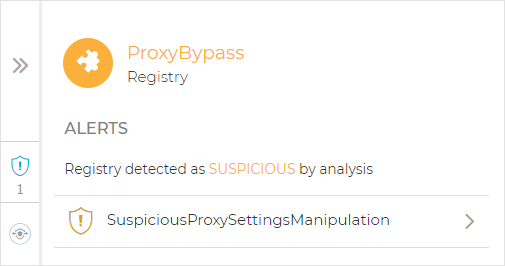
ALERTS. This section displays one or multiple detections triggered on the selected node, including details about the Bitdefender technology that included the element in the incident, the reason that triggered the detection, detection name, and the date when it has been detected.
INVESTIGATION. This section displays date stamps for the initial detection and all the endpoints where this element was spotted.
REMEDIATION. This section displays actions taken automatically by GravityZone, actions you can take immediately to mitigate the threat, as well as detailed recommendations for each alert detected on the selected node to assist you in mitigating the incident and increase the security level of your environment.
INFO. This section displays general information about each file, and specific information depending on the type of node selected.
You can drag the Node Details panel towards the center of the screen to easily go through its contents.
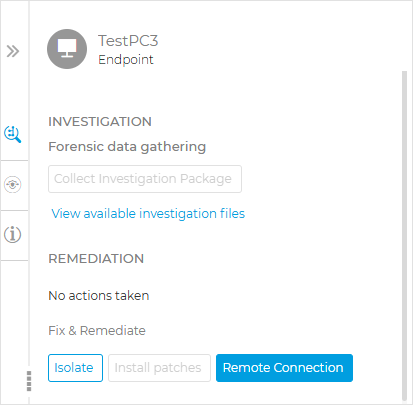
The Endpoint details panel includes two sections:
REMEDIATION. Displays info about the actions taken automatically by GravityZone to mitigate threats and actions you can take.
Note
The range of actions you can take may vary depending on the license included in your current plan.
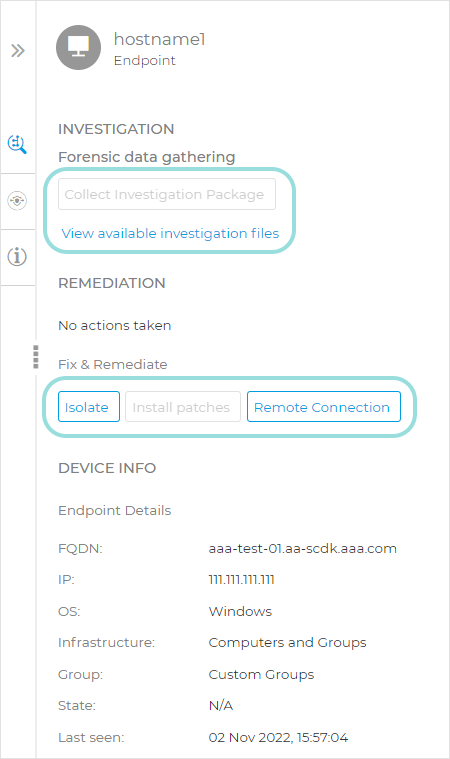
Isolate Host - Use this remediation solution to isolate the endpoint from the network.
Install patches - Use this action to install a missing security patch on the target endpoint. This option is visible only with the Patch Management module, an add-on available with a separate license key. Learn more about installing patches here.
Remote Connection - use this action to to establish a remote connection to the endpoint involved in the current incident and run a number of custom shell commands directly on its operating system, for mitigating the threat instantly or collecting data for further investigation.
DEVICE INFO. Displays general information about the affected endpoint, such as endpoint name, IP address, operating system, pertaining group, state, active policies, and a link that opens a new window where full endpoint details are displayed.
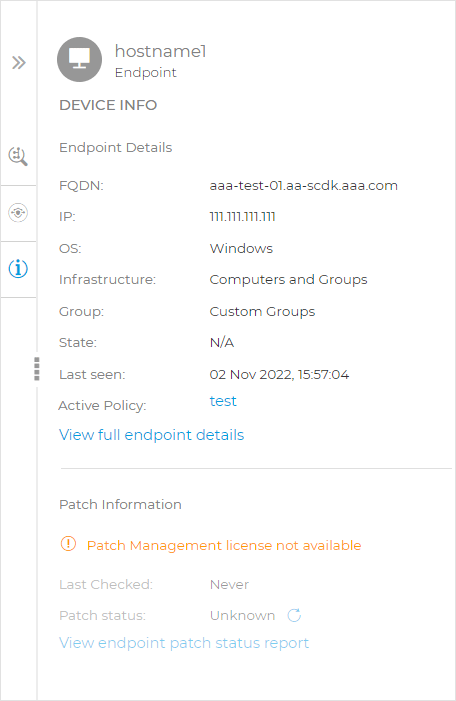
It also provides with information such as the number of installed patches, failed patches, or any missing security and non-security patches.
In addition, you can generate an endpoint patch status report. This section is provided on demand for the target endpoint.
You can take the following actions within the panel:
View patch information for target endpoint. To view patch details, click the Refresh button.
View patch status report for target endpoint. To generate the report, click the View endpoint patch status report button.
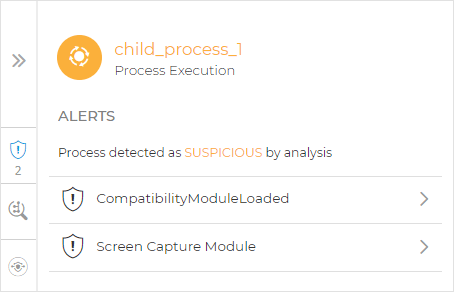
The details panel for process nodes includes four sections:
ALERTS. Displays one or multiple detections triggered on the selected node, including details about the Bitdefender technology that included this entity in the incident, the reason that triggered the detection, detection name, and the date when it has been detected. The description for each alert follows the latest MITRE standards.
INVESTIGATION. Displays the date stamp for the initial detection and all the endpoints where this threat was spotted.
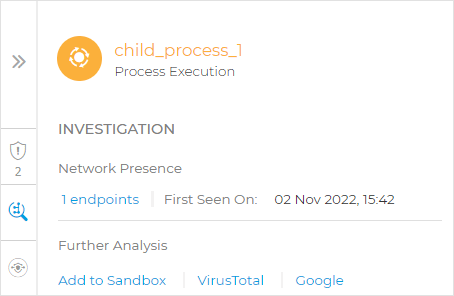
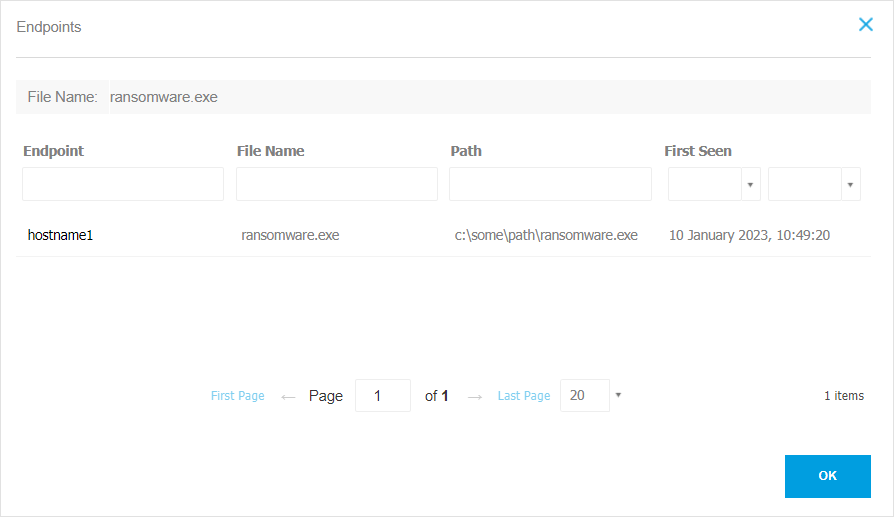
To view this list, click the number shown in the endpoints field and a new window will pop up.
This section also provides external analysis through internal components and third-party solutions.
The following actions are available:
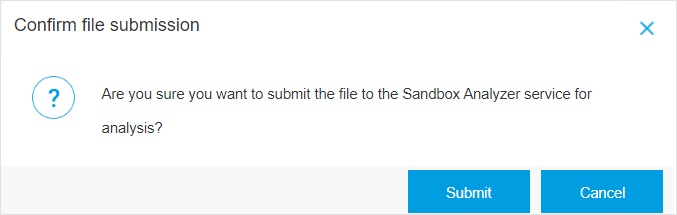
Add to Sandbox - Use this action to generate a Sandbox Analyzer report.
Choosing Add to Sandbox prompts you with a screen to confirm file submission.
After confirmation, you are automatically redirected to the submission screen.
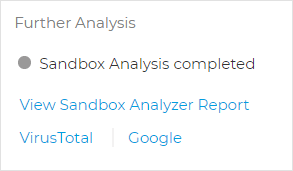
When the analysis is completed, click the View Sandbox Analyzer Report button to open the full report.
VirusTotal - Use this action to submit a file externally for analysis.
Google - Use this action to search online the hash value of a file.
REMEDIATION. Displays info about the actions taken automatically by GravityZone to mitigate threats and actions you can take.
Note
The range of actions you can take may vary depending on the license included in your current plan.
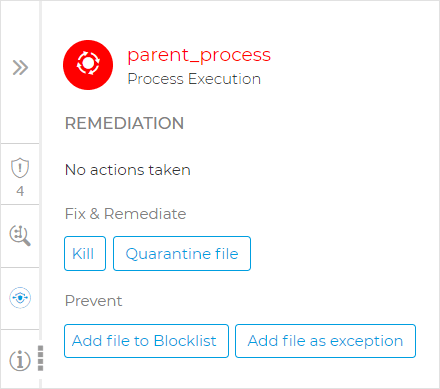
Kill - Use this action to stop a process execution. This action creates a kill process task visible in the process execution bar.
System32and Bitdefender processes are excluded from this action.Quarantine file - Use this action to store the item in question and prevent it from executing its payload. This action requires the Firewall module to be installed on the target endpoint.
Add file to Blocklist - Manage blocked items in the Blocklist page.
Note
Only users with GravityZone administrator role can add files to Blocklist.
Add file as exception - Use this option to exclude legitimate activity on a specific policy. When you choose this action, a configuration window prompts you to select the policy where you want to add an exception. Manage exclusion under Policies > Antimalware > Settings.
This section also provides detailed recommendations for each alert detected on the selected node to assist you in mitigating the incident and increase the security level of your environment.
PROCESS INFO. Displays details about the selected process node, including process name, executed command line, user, time of execution, file origin and path, hash value, or digital signature.
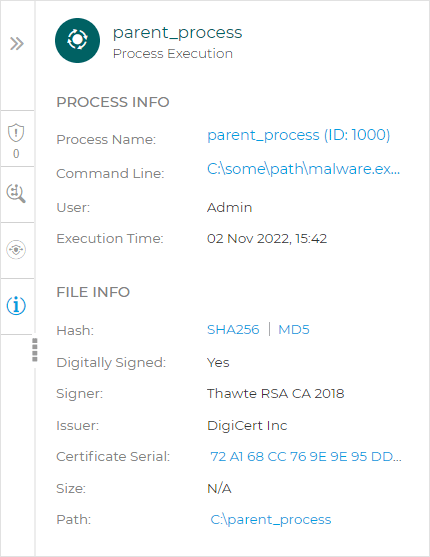
In this section you can copy the item's hash value to clipboard by clicking the available hashing algorithms within the Hash field, and add it to Blocklist.
Note
For more information, refer to Blocklisting files.
The File node details panel includes four sections:
ALERTS. Displays one or multiple detections triggered on the selected node, including details about the Bitdefender technology that included this entity in the incident, the reason that triggered the detection, detection name, and the date when it has been detected. The description for each alert follows the latest MITRE standards. Each alert detected on the selected node provides detailed recommendations to assist you in mitigating the incident and increasing the security level of your environment.
INVESTIGATION. Displays date stamps for the initial detection and all the endpoints where this element was spotted.
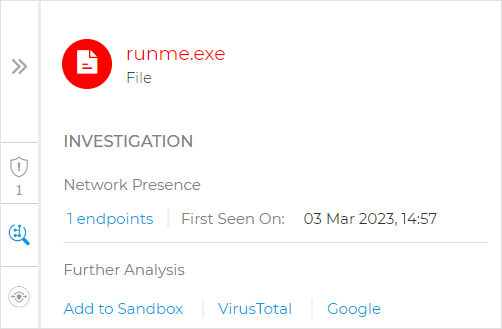
To view this list, click the number shown in the endpoints field and a new window will pop up.
This section also provides external analysis through internal components and third-party solutions.
The following actions are available:
Add to Sandbox - Use this action to generate a Sandbox Analyzer report.
Choosing Add to Sandbox prompts you with a screen to confirm file submission.
After confirmation, you are automatically redirected to the submission screen.
When the analysis is completed, click the View Sandbox Analyzer Report button to open the full report.
VirusTotal - Use this action to submit a file externally for analysis.
Google - Use this action to search online the hash value of a file.
REMEDIATION. Displays info about the actions taken automatically by GravityZone to mitigate threats and actions you can take.
Note
The range of actions you can take may vary depending on the license included in your current plan.
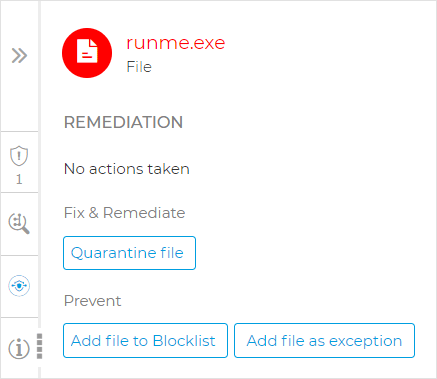
Quarantine file - Use this action to store the item in question and prevent it from executing its payload. This action requires the Firewall module to be installed on the target endpoint.
Add file to Blocklist - Manage blocked items in the Blocklist page.
Add file as exception - Use this option to exclude legitimate activity on a specific policy. When you choose this action, a configuration window prompts you to select the policy where you want to add an exception. Manage exclusion under Policies > Antimalware > Settings.
FILE INFO. Displays details about the selected file node, including file origin and path, hash value, or digital signature.
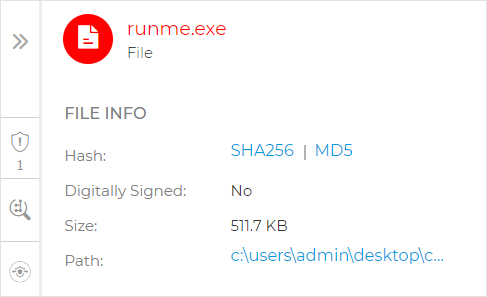
In this section you can copy the item's hash value to clipboard by clicking the available hashing algorithms within the Hash field, and add it to Blocklist.
Note
For more information, refer to Blocklisting files.
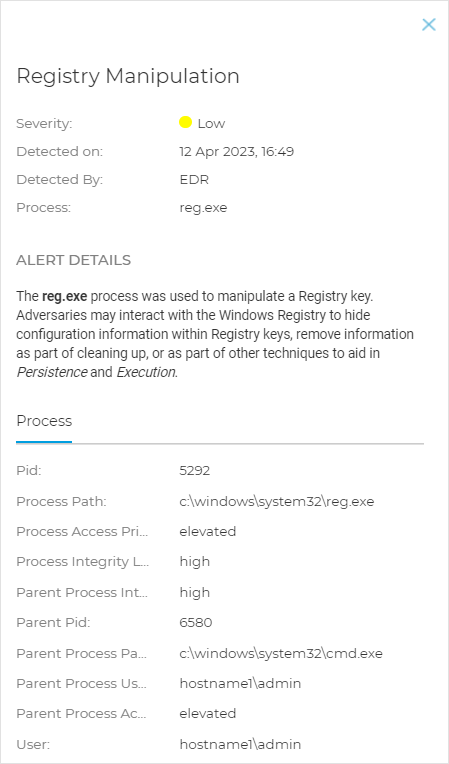
The Registry node details panel includes three sections:
ALERTS. Displays the severity of the registry manipulation as marked by the Bitdefender technology that included this entity in the incident, the reason that triggered the detection, the date when it has been detected, and registry type.
REMEDIATION. Displays info about the actions taken automatically by GravityZone.
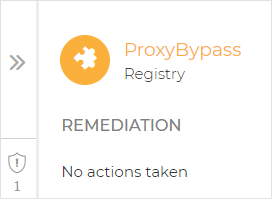
Note
The REMEDIATION section for registry nodes does not provide any user action option.
REGISTRY INFO. Displays details about the selected registry node, including registry key, value and data.
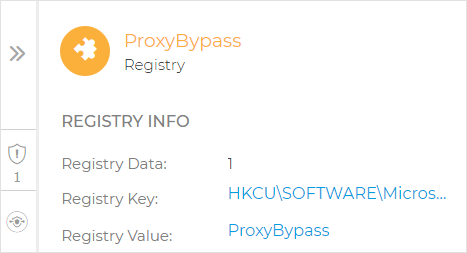
You can click the registry key and value to copy it to clipboard for further analysis purposes.
Search bar
The Search bar has two functionalities:
Search nodes. Click
 and the search bar expands, allowing you to enter information and search the graph for particular nodes.
Incident trigger. A direct link to the node that triggered the alert.
Events
Use the Events tab to view how the sequence of events unfolded into triggering the currently investigated incident. This window displays the correlated system events and alerts detected by GravityZone technologies such as EDR, Network Attack Defense, Anomaly Detection, Advanced Anti-Exploit, or Windows Antimalware Scan Interface (AMSI).
Note
The availability of technologies involved in the detection process may differ depending on the license included in your current plan.
Every event has a detailed description explaining what was detected and what might happen if the artifact is used for malicious purposes, in accordance with the latest MITRE techniques and tactics.
Use the filtering options to display all events, or group them by ATT&CK tactics. You can also use the search bar to find events after predefining their category. The grid is populated with the sorted events.
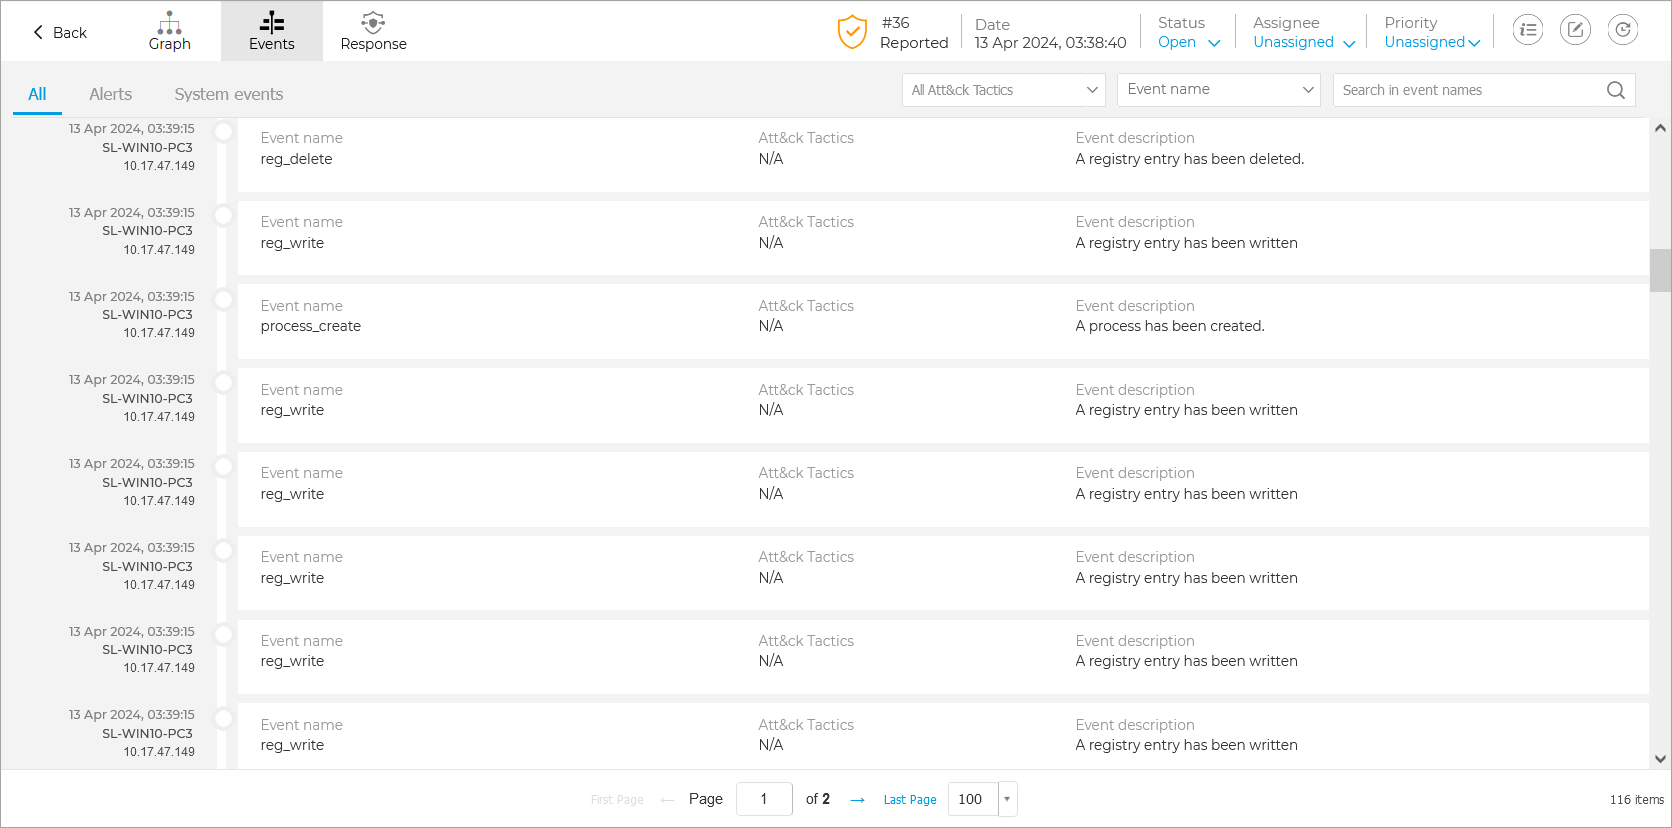
Select any event in the grid to open its side panel and analyze detailed information about the detection, including process activity, affected files, and attack context.
EDR Response
The Response page provides default smart views that you can use to access actions that need immediate attention, pages that display actions that have a specific status, such as In Progress, Completed, or Dismissed, or a list of all Responses that are associated to a specific incident.
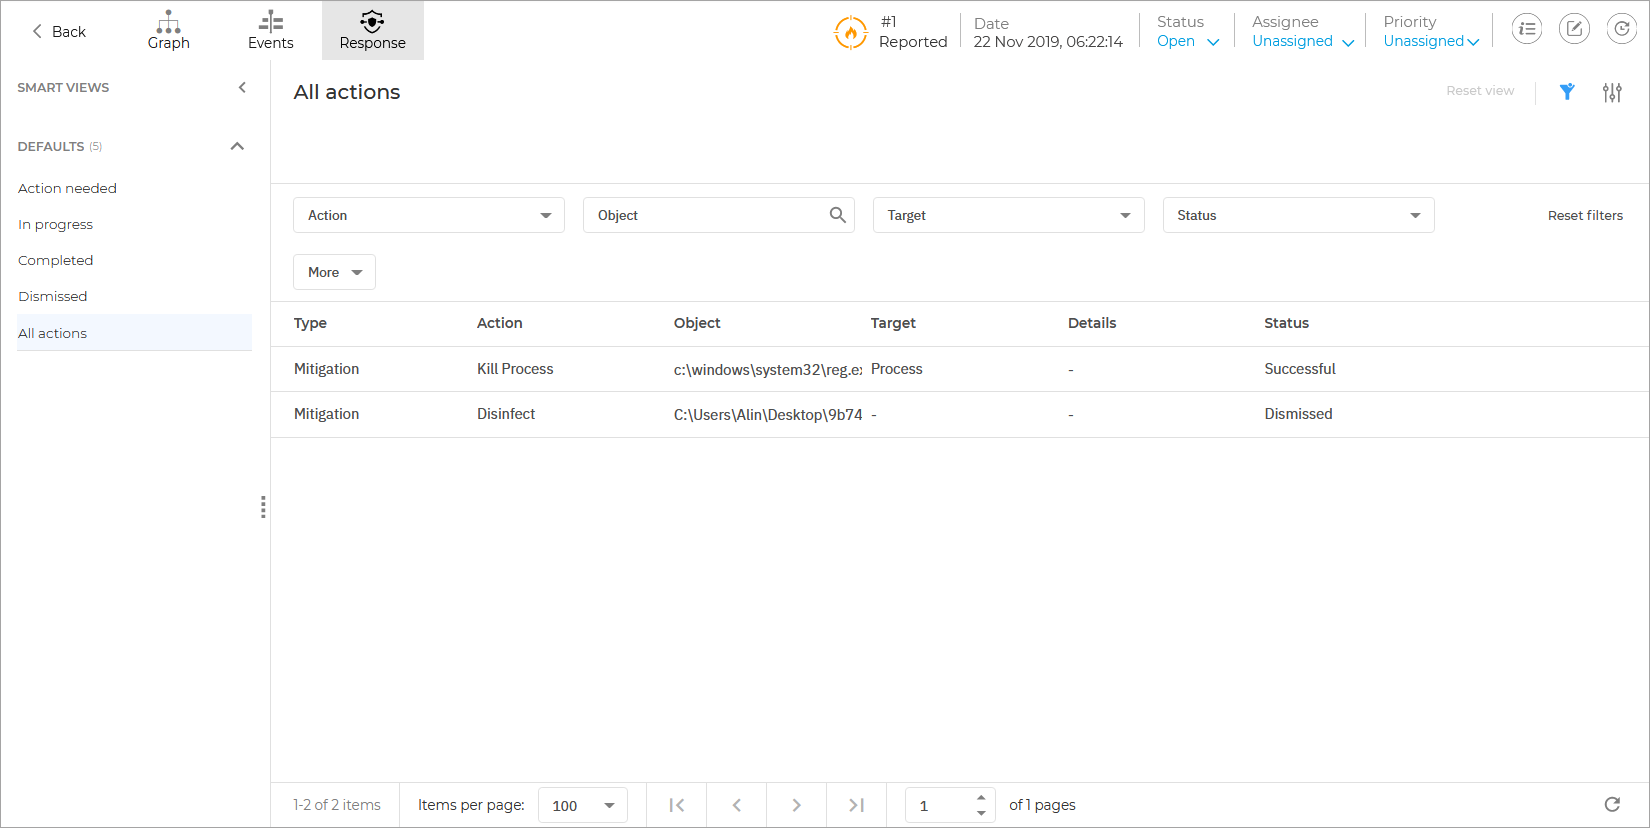
All actions are available in a dynamic grid formation with multiple filtering and sorting options, such as filtering by action type, object, target, status and more.
Multiple columns are available and contain the following information:
Type - The type of action being taken. Possible values:
ContainmentMitigationHardening
Action - The name of the action being taken.
Object - The name of the entity or resource on which the action is being taken.
Note
If the object is an endpoint, the name is a clickable link and will open the Endpoint Details panel.
Target - The type of entity on which an action is taken. Possible values:
EndpointFileProcessRegistry
Details - Provides additional information related to the action being taken.
Executed on - The date when the action was triggered. If the action is the result of an automated response, the date when the endpoint reported it is displayed.
Executed by - Indicates who performed the action.
Source - Indicates where the action originated from.
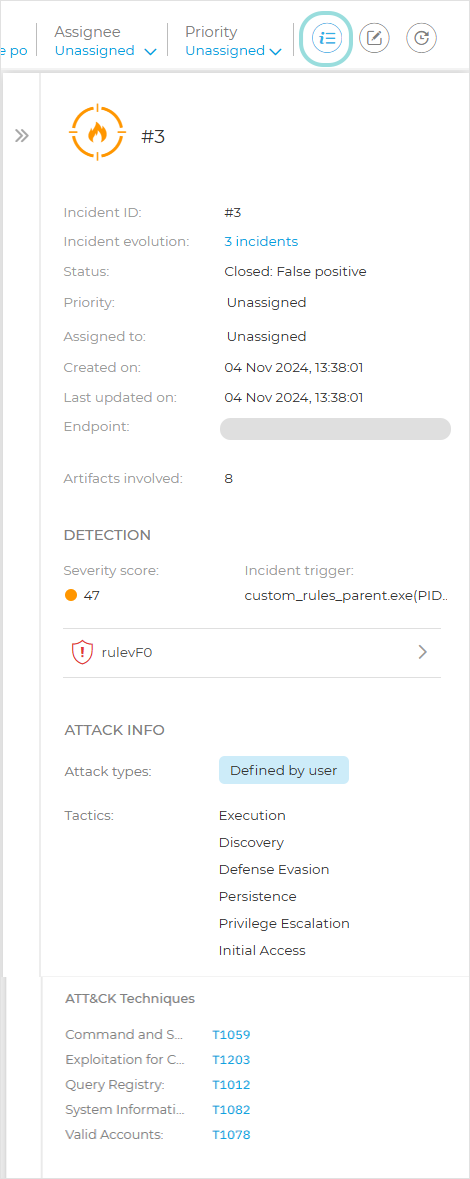
Incident Info
The incident details panel accessed from the incident status bar, from the Incident info button, provides a comprehensive overview of a selected incident, including its identification, status, and key investigation data. It displays essential information such as the incident ID, evolution, status, priority, assignment, timestamps, and affected endpoint.
Important
The Incident evolution field is displayed only when the Create a separate incident when new activity is detected option is enabled in the Configuration > Miscellaneous tab, under the Incidents section. To view details, click the number of incidents. A panel will open displaying all related incidents, their status, and links that you can copy for each one.
The panel also includes details such as severity score, incident trigger, the alerts detected on the incident trigger, and involved artifacts. Additionally, it offers insights into the attack context, including attack types, tactics, and mapped MITRE ATT&CK techniques, helping you quickly understand the nature and impact of the incident.
Incident Status Bar
The incident status bar provides security event tags that can help you detect key information about the involved network endpoints.
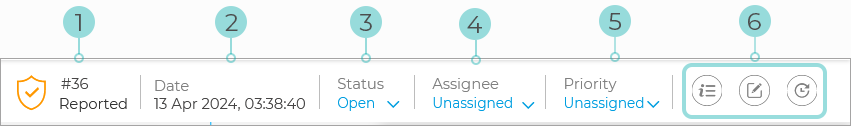
Incident ID - the id number of the incident under investigation and if the incident is either blocked or reported.
Detection timestamp - the date and time the incident was triggered.
Status - the current incident status.
Assignee - the user that the incident is assigned to.
Priority - the priority of each incident.
Access icons and their description:
Notes clipboard
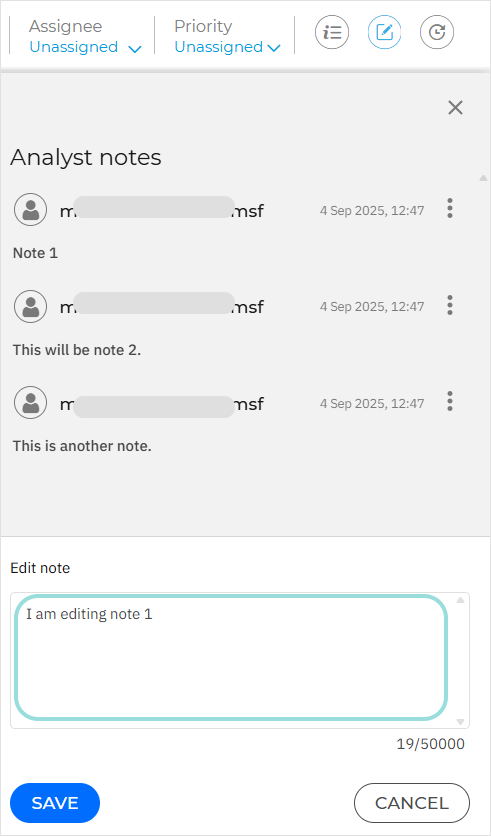
The Notes clipboard provides an easy way to add notes to incidents for tracking changes and incident ownership.
Displaying notes
To display a list of available notes, click the Notes button on the right side of the Status bar:
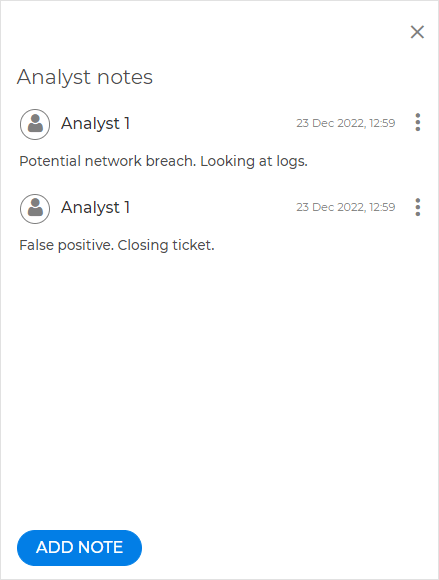
Note
Alongside each note, the username of its creator will be displayed. If the user belongs to a partner company, the name Partner will be displayed instead.
Adding a note
To add a note, follow the steps below:
Click the Add note button on the lower left side of the clipboard.
Fill in the note information.
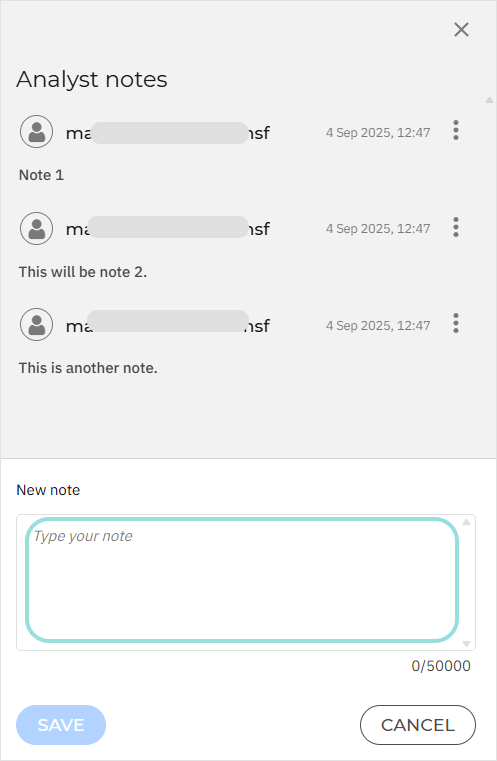
Note
Each note can contain up to 50,000 characters.
Select Save.
Note
In case of bulk actions, a single note will be added in bulk for all incidents.
Editing a note
To edit a note, follow the steps below:
Select the Menu button on the right side of the note you wish to edit.
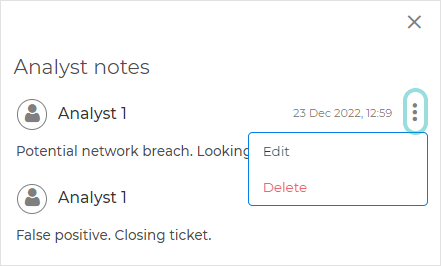
Select Edit.
Make the necessary modifications:
Note
Each note can contain up to 50,000 characters.
Select Save.
Note
If you wish to cancel editing the note, click Cancel, then select Discard.
Deleting a note
To delete a note, follow the steps below:
Select the Menu button on the right side of the note you wish to delete.
Select Delete.
Note
This option is only available for your own notes.
Select Delete again.
History Clipboard
The History panel provides an easy way to track the history of an incident. The following events are tracked:
Status changed
Assigned or reassigned incident
Incident priority set or changed
Incident note added, edited, or deleted
Created incident
Updated incident
The list is displayed in chronological order from newest at the bottom to oldest at the top:
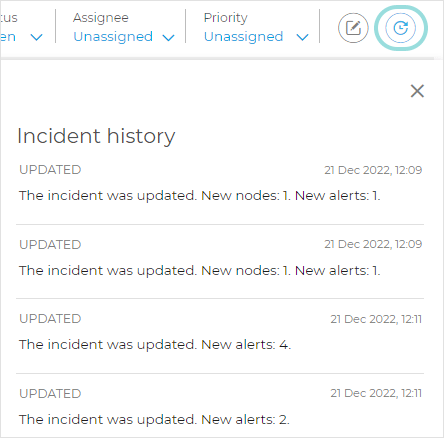
Each event will contain the following information:
The type of the event
A description of the event
The date and time at which the event occurred
Note
Some events, such as Assigned, Status changed, and Priority changed, also include details about the user who performed the action.
Remote Connection
Prerequisites
To be able to start a terminal session in a remote connection to an endpoint, ensure that:
The version of Bitdefender agent installed on the endpoint supports the Remote Connection feature.
The endpoint is powered on and online.
The endpoint has Windows OS.
GravityZone can communicate with the endpoint.
Your GravityZone account has manage permissions for the target endpoint.
Starting a remote connection
To access an endpoint via a remote connection, follow these steps:
Go to the Incidents page.
Click the endpoint incident you want to investigate.
In its graph, click the node of the endpoint you need to connect to.
A details panel will be displayed to the right.
Click the Remote Connection button in the details panel.
The Remote connection window will be displayed.
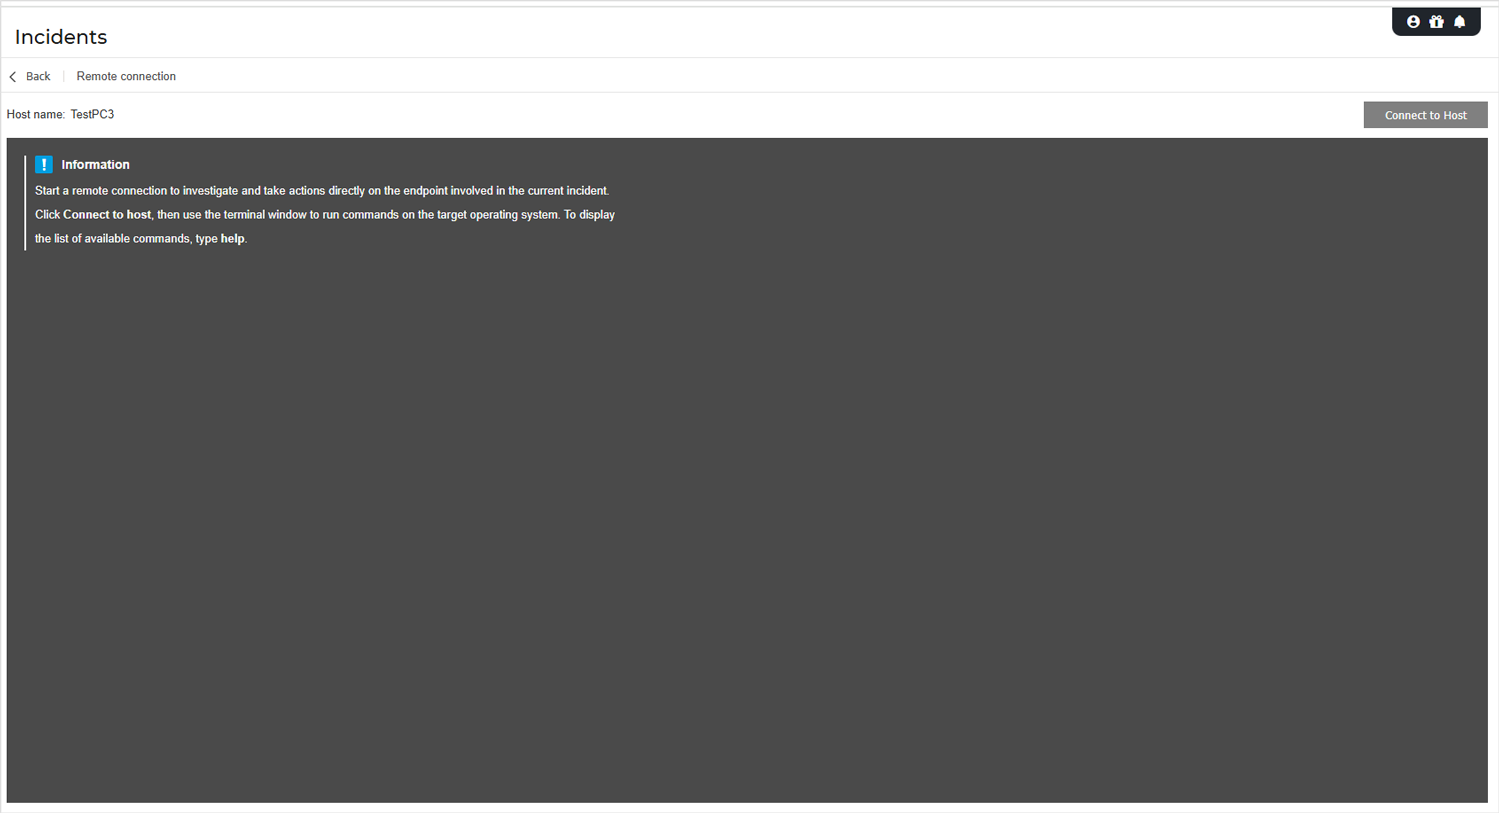
Click Connect to Host to start a remote connection to investigate and take actions directly on the endpoint involved in the current incident.
In the terminal, you can now run several custom shell commands directly on the endpoint's operating system, for removing the threat instantly or collecting data for further investigation.
Important
The Remote connection feature is available only from the incident details panel and provides access to a predefined set of commands.
Start the live session by clicking the Connect to Host button.
The connection status will be displayed next to the endpoint name.
If the connection fails, an error message will be displayed in the terminal window.
Note
You can open maximum five terminal session with the same endpoint simultaneously.
Once connected, the terminal displays the list of available commands and their description.
Type the command that you want in the terminal window followed by
Enter.Note
To learn more about a command, type
helpfollowed by the command name (for example,help ps).The terminal displays the command output, when the command is successful.
If the endpoint fails to complete the command execution, the command will be discarded.
To end the connection, click the End Session button.
The terminal session expires automatically after five minutes of inactivity.
By navigating outside the Remote Connection tab while connected to an endpoint will also end the terminal session.
Terminal Session Commands
EDR terminal session commands are custom-built shell commands, platform independent, using a generic syntax. Find hereinafter the list of available commands you can use on endpoints through the terminal session: