Navigating GravityZone
In GravityZone, each main menu and header menu item has a distinct URL. You can open a menu entry in a new tab or window, or access it by entering its specific URL. This feature allows for faster access to specific sections without navigating from the landing page.
To move between previously accessed sections you can use the browser’s back and forward buttons.
Table data
Tables are frequently used throughout the console to organize data into an easy-to-use format.
Navigating through Pages
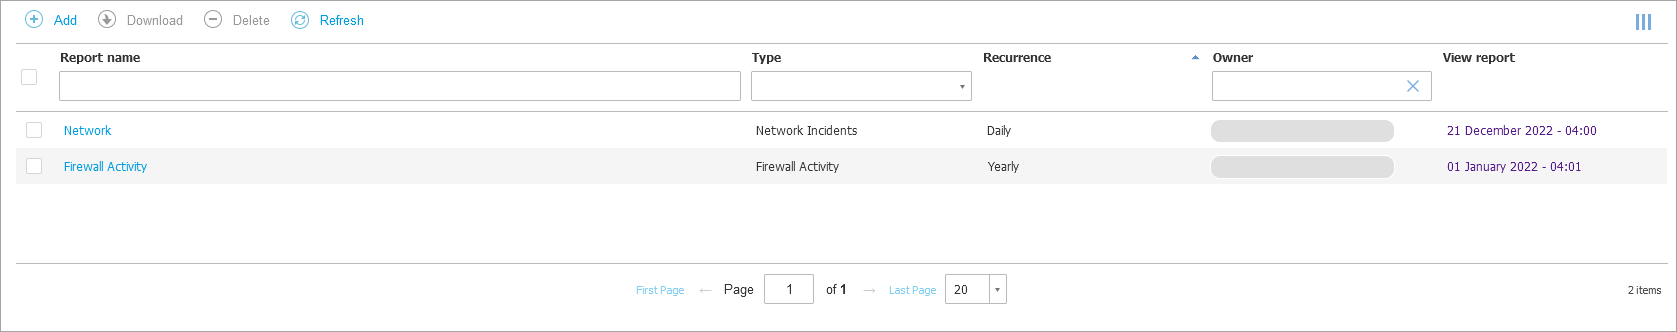
Tables with more than 20 entries span on several pages. By default, only 20 entries are displayed per page.
To move through the pages, use the navigation buttons at the bottom of the table. You can change the number of entries displayed on a page by selecting a different option from the menu next to the navigation buttons.
Searching for Specific Entries
To easily find specific entries, use the search boxes available below the column headers.
Enter the search term in the corresponding field. Matching items are displayed in the table as you type. To reset the table contents, clear the search fields.
Sorting Data
To sort data by a specific column, click the column header. Click the column header again to revert the sorting order.
Refreshing Table Data
To make sure the console displays the latest information, click the  Refresh button at the upper side of the table. This may be needed when you spend more time on the page.
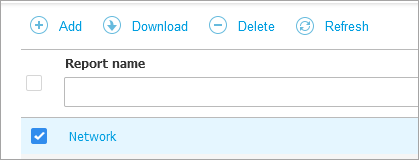
Action toolbars
In Control Center, action toolbars allow you to perform specific operations pertaining to the section you are in.
Each toolbar consists of a set of icons that is usually placed at the upper side of the table.
For example, the action toolbar in the Reports section allows you to perform the following actions:
 Create a new report.
 Download a scheduled report.
 Delete a scheduled report.
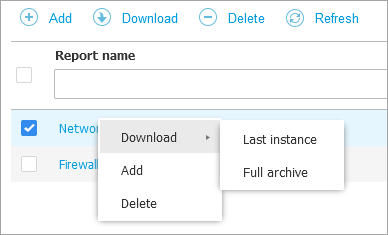
Contextual menu
The action toolbar commands are also accessible from the contextual menu. Right-click the Control Center section you are currently using and select the command that you need from the available list.
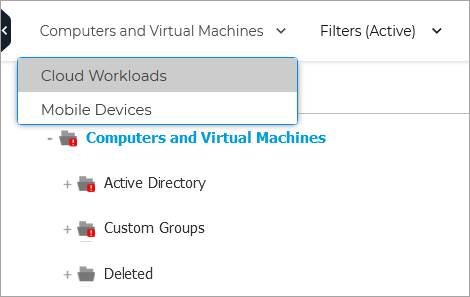
Views selector
If you work with different types of endpoints, you can find them organized in the Network page by type under several network views:
Computers & and Virtual Machines: displays Active Directory groups and computers and also physical and virtual workstations outside Active Directory that are discovered in the network.
Virtual Machines: displays the infrastructure of the virtual environment integrated with Control Center and all the containing virtual machines.
Mobile Devices: displays users and the mobile devices assigned to them.
To select the network view that you want, click the views menu in the upper-right corner of the page.
Note
You will see only the endpoints you have permissions to view, permissions granted to you by the administrator who added your user to Control Center.