Overview
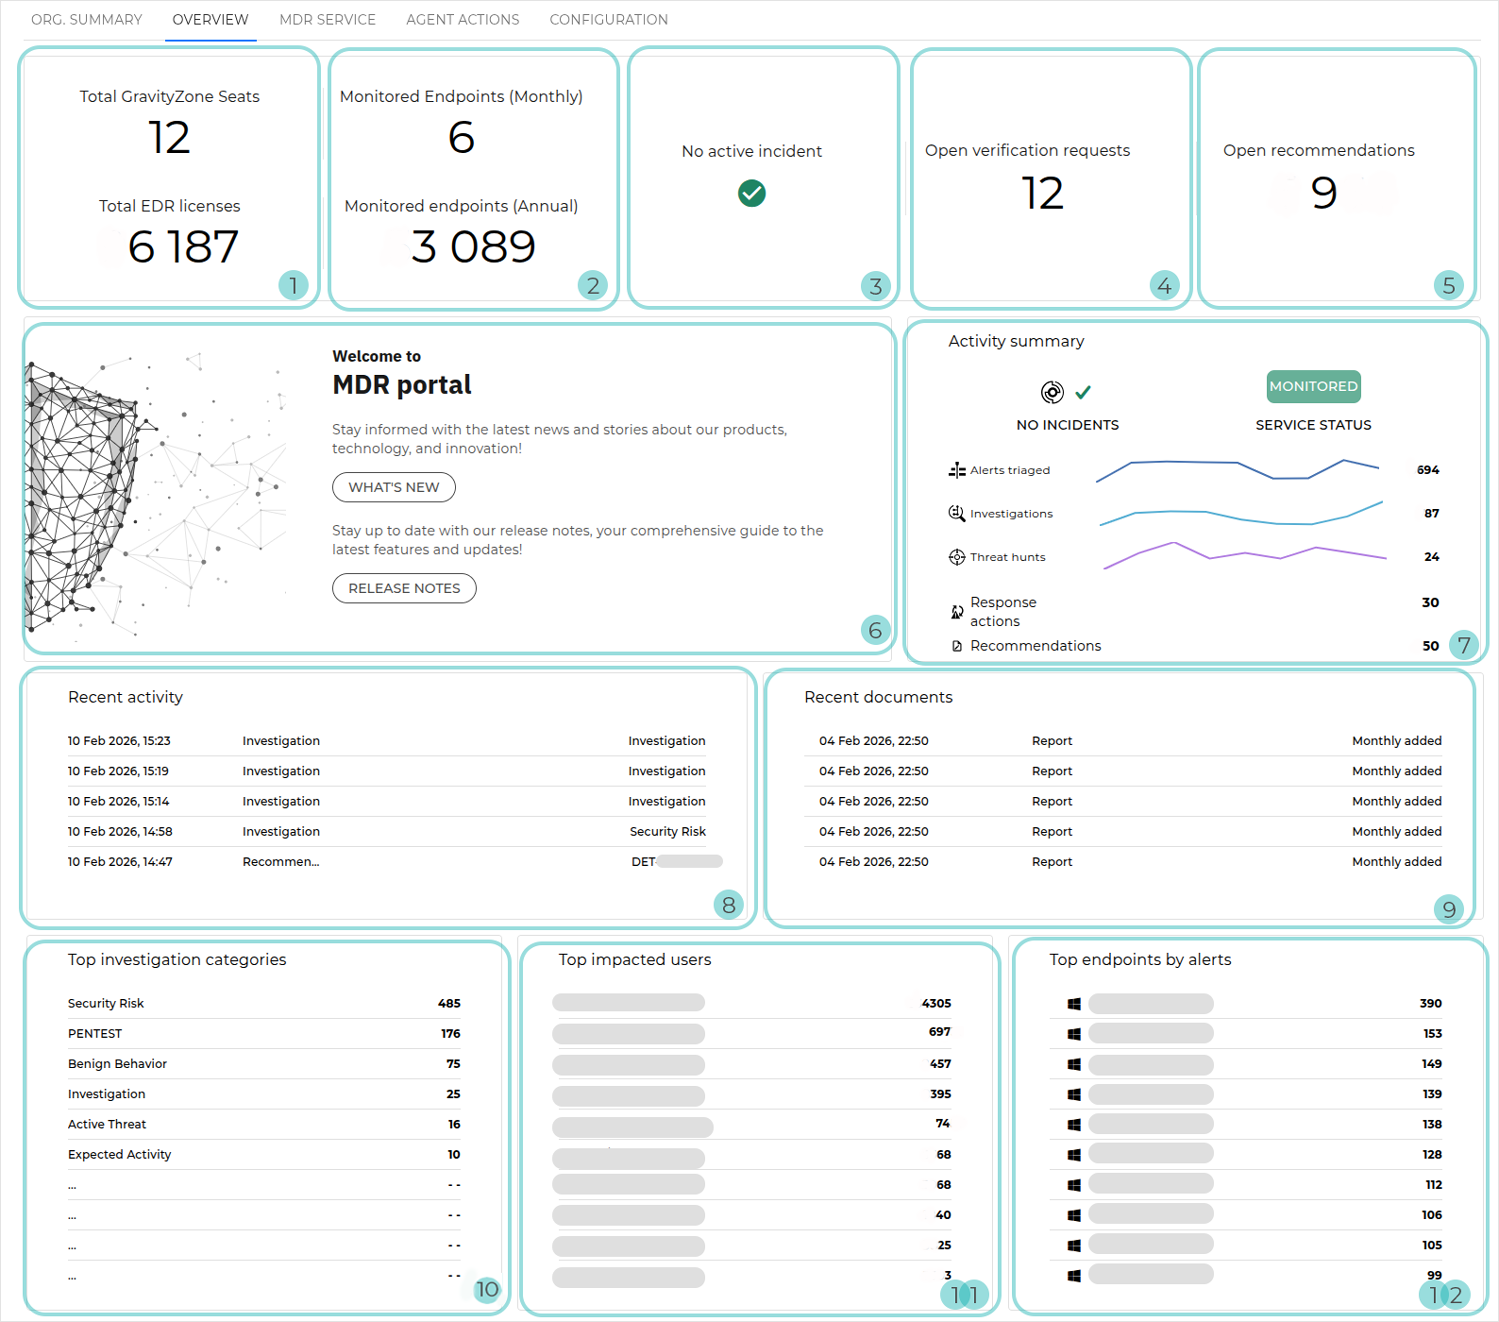
The following Overview layout applies to hybrid Partners with at least one Customer with an advanced service model, such as Bitdefender MDR Plus, Bitdefender MXDR Plus, MDR Premium, or MDR Enterprise.
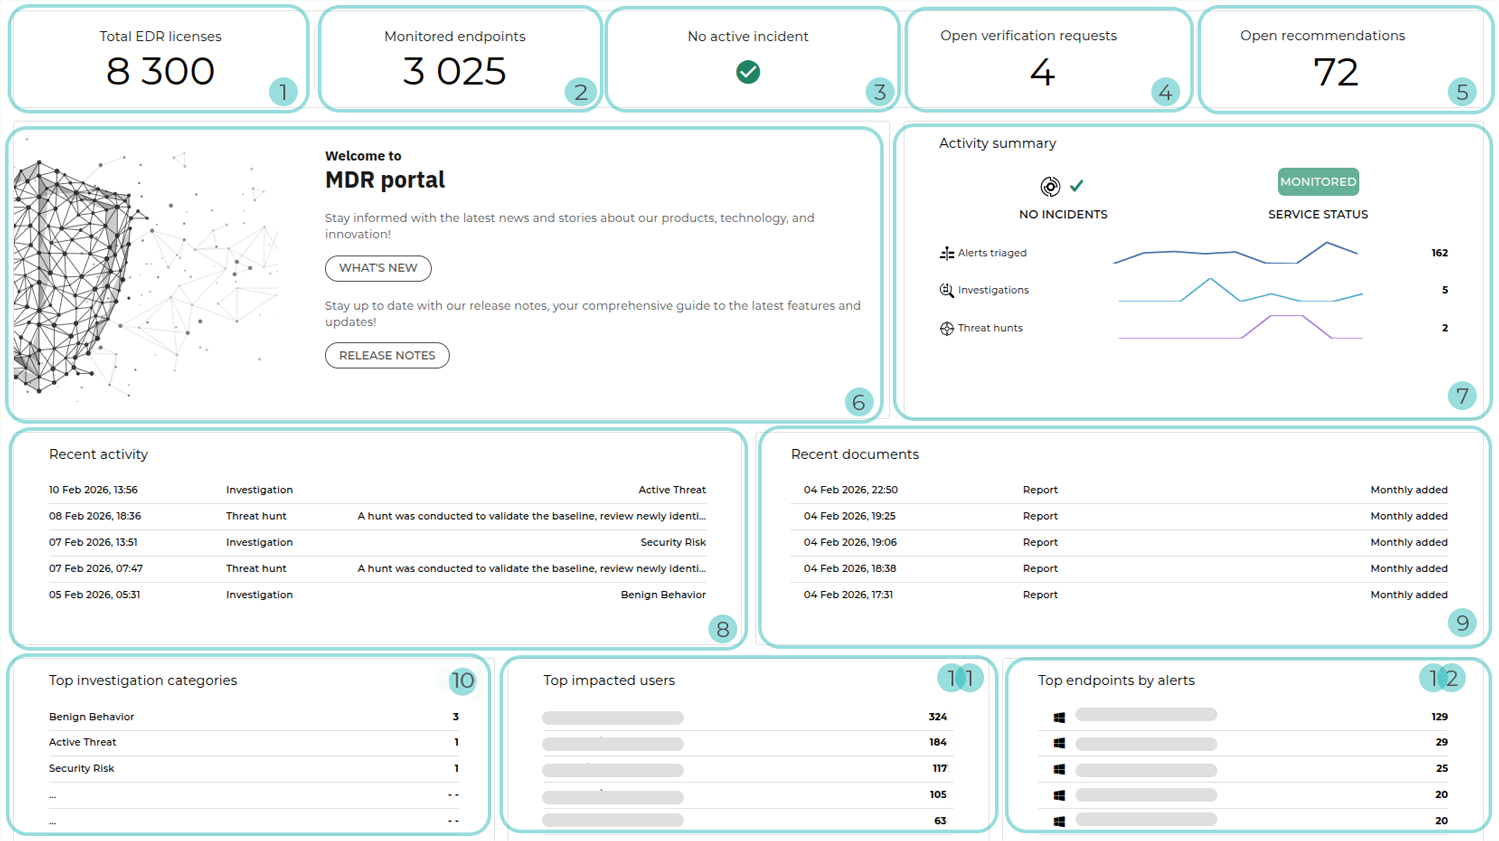
The following Overview layout applies to non-MSP Partners with at least one Customer with an advanced service model, such as: Bitdefender MDR Plus, Bitdefender MXDR Plus, MDR Premium, or MDR Enterprise.
The following Overview layout applies to Customers on an annual advanced MDR plan.
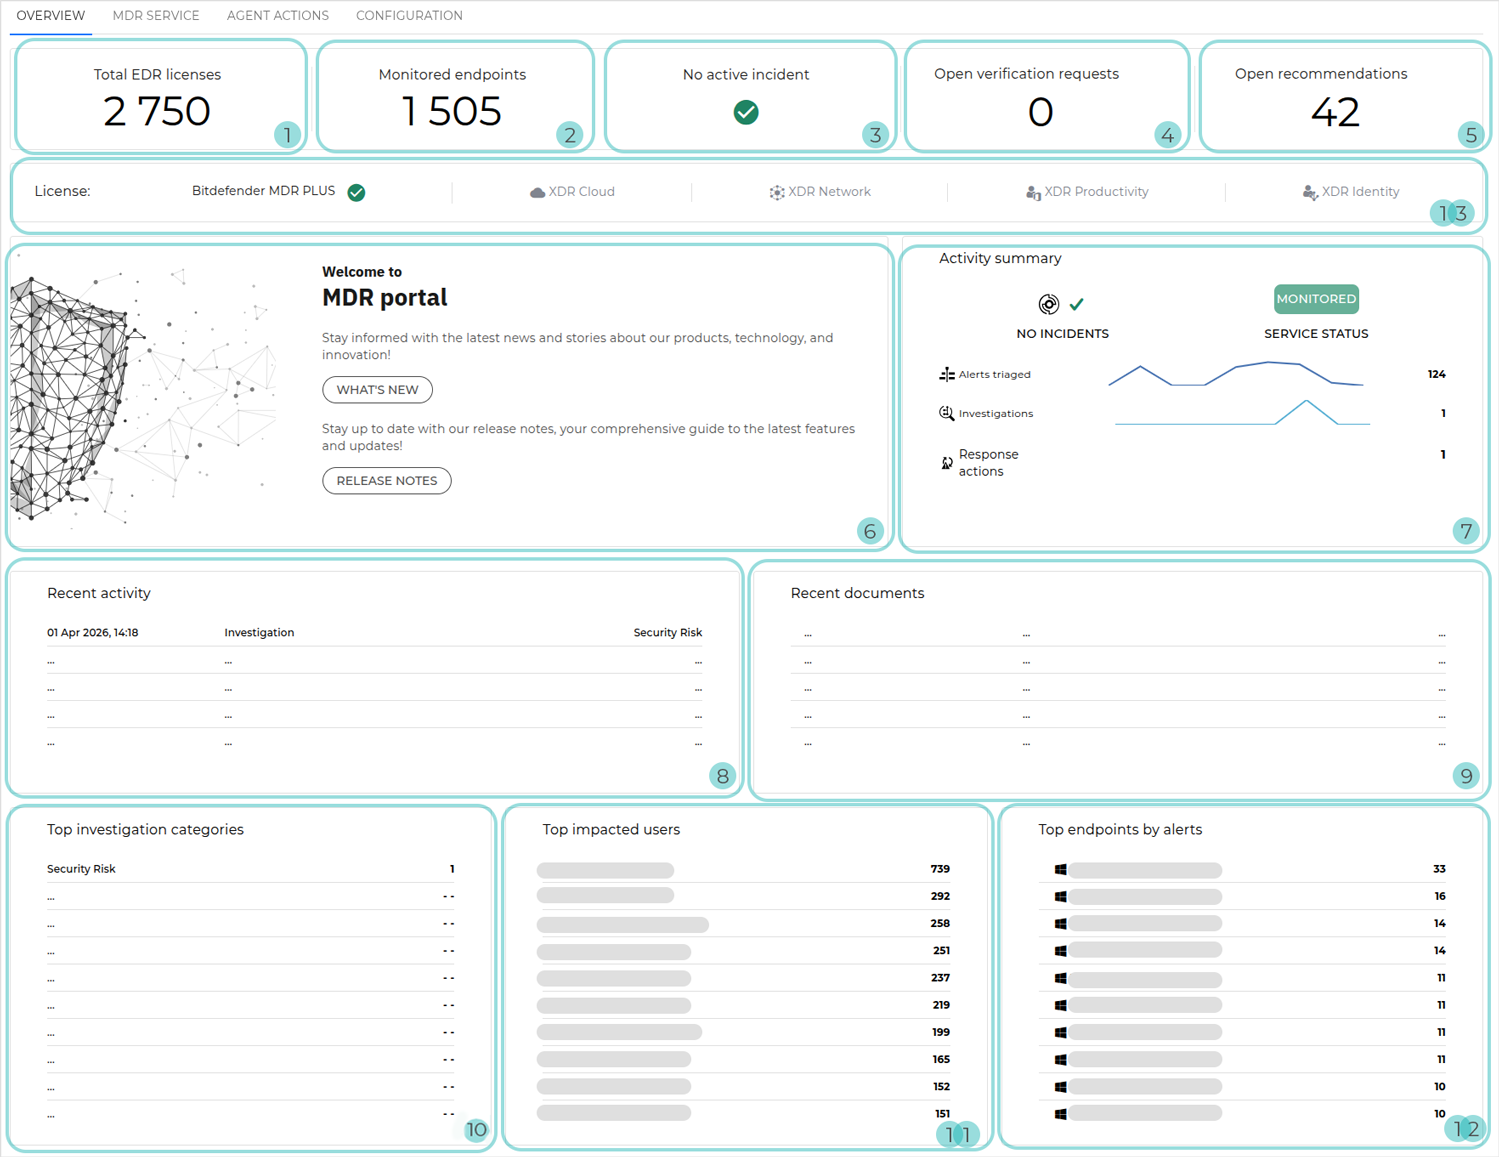
Total EDR licenses: The total count of MDR-licensed endpoints across all managed Customers with a yearly license
For hybrid Partners, Total GravityZone Seats is also displayed: The aggregate reserved endpoint count across managed Customers on a monthly subscription. Customers with no reserved seats are included using their current month’s endpoint usage.
Monitored endpoints: The total number of endpoints actively monitored by MDR
Note
Endpoints are considered monitored if they have sent telemetry to the MDR service at least once during the current month.
For hybrid Partners, this information is displayed separately for Customers with a yearly license and Customers with a monthly subscription.
Active incidents: The number of ongoing investigations that have been escalated to high or critical severity and are currently being mitigated by the SOC team. An active incident indicates the presence of an active threat in the environment, such as an intruder or active malware.
Open verification requests: The number of verification requests that are currently open within all managed companies
Open recommendations: The number of recommendations that are currently open within all managed companies
Welcome to MDR portal: Welcoming section that lets you navigate to the MDR release notes and the What’s New page to review recent changes in the MDR and GravityZone consoles
Activity summary: Widget providing an overview of security activity and service status for the time interval selected in the dashboard
The following information may be displayed:
Service status: Indicates whether MDR is actively monitoring your environment or the onboarding process has not yet been completed.
Incidents number: The number of incidents declared during the selected time range
Alerts triaged: The number of detections that were received from GravityZone and, after being triaged by the SOC, were deemed not to need further investigation
Investigations: The number of investigations initiated by the MDR team
Threat hunts: The number of threat hunting activities performed
Recommendations: The number of recommendations issued by MDR
Response actions: The number of response actions taken by the SOC in the selected environment
Trend indicators next to each activity illustrate how event volume has changed over the selected time frame.
Recent activity: The five most recent activities within all managed companies. The following information is included:
Activity type: It can be Investigation, Recommendation, or Threat hunt.
Date and time of detection
Activity description
Recent documents: The latest documents from all managed companies. For each document, the upload date and time, document type, and description are displayed.
Tip
Selecting an entry opens the document on a separate page.
Top investigation categories: The categories with the highest number of investigations across all managed companies, including the category name and the corresponding investigation count
Tip
Clicking any of the listed items opens the Investigations page.
Top impacted users: Users with the highest number of related alerts
Top endpoints by alerts: Endpoints with the highest number of related alerts. The following information is included:
Operating system icon
Hostname
Number of alerts
License bar: The activated licenses for the MDR service model and XDR add-ons purchased by the Customer-type company selected via the company selector.