Customer's dashboards
Customer with an advanced MDR service model
The following Dashboards layout applies to Customers on an annual advanced MDR plan, such as Bitdefender MDR Plus, Bitdefender MXDR Plus, MDR Premium, or MDR Enterprise.
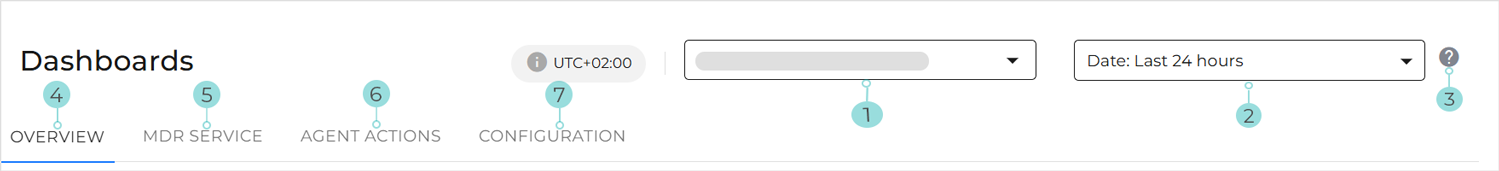
Company selector: If you are a Partner reviewing your Customers’ dashboards, you can click it to switch between companies and view the corresponding dashboards. You can select All managed companies or a specific managed company.
Important
This selector is not displayed for Customers.
Time frame selector: Allows you to select the predefined time range, relative to the current time, used to display dashboard data. Available options are:
Last 24 hours
Last 7 days
Last 30 days
Info button: Clicking it opens the Knowledge Base article relevant to the Dashboards page.
Overview tab: A snapshot of the MDR service status across the Customer's company, highlighting key metrics such as licensed and monitored endpoints, incidents, verification requests, and recommendations. It also offers visibility into recent activity, recent documents, investigation trends, and the most impacted users and endpoints, enabling quick operational insight at a glance.
Tip
For more details on the Overview tab, refer to Overview.
MDR service tab: Centralized overview of MDR activities within the selected time range. It highlights investigation trends by severity, threat hunting outcomes, and recent operational activity, offering visibility into both reactive and proactive security efforts. It helps you quickly assess risk levels, ongoing investigations, and overall MDR performance.
Tip
For more details on the MDR service tab, refer to MDR service.
Agent actions tab: An overview of the alerts generated and the automated remediation actions taken within the selected time range. It highlights alert trends, the most frequent alert types, and the most mitigated threats, along with the corresponding automated responses.
Tip
For more details on the Agent actions tab, refer to Agent actions.
Configuration tab: An overview of the MDR service setup and endpoint monitoring coverage across the selected environment, including licensing status, endpoint activity, alert distribution, and deployment readiness.
Tip
For details about the Configuration tab, refer to Configuration.
Customer with a standard MDR service model
The following Dashboards layout applies to:
Customers with a monthly subscription
Customers on an annual standard MDR plan, such as Bitdefender MDR or Bitdefender MXDR
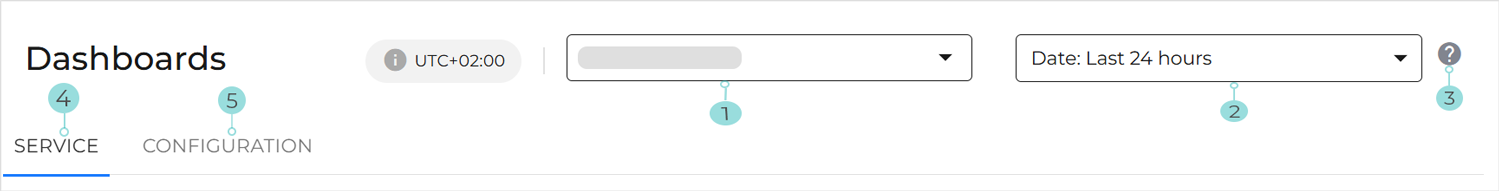
Company selector: If you are a Partner reviewing your Customers’ dashboards, you can click it to switch between companies and view the corresponding dashboards. You can select All managed companies or a specific managed company.
Important
This selector is not displayed for Customers.
Time frame selector: Allows you to select the predefined time range, relative to the current time, used to display dashboard data. Available options are:
Last 24 hours
Last 7 days
Last 30 days
Info button: Clicking it opens the Knowledge Base article relevant to the Dashboards page.
Service tab: A centralized view of the MDR service in the selected environment, offering visibility into monitored endpoints, service status, number of incidents, and recent activity. It also highlights enabled XDR capabilities and gives quick access to updates, release notes, and key operational insights within the MDR console.
Tip
For details about the Service tab, refer to Service.
Configuration tab: An overview of the MDR service setup and endpoint monitoring coverage across the selected environment, including licensing status, endpoint activity, alert distribution, and deployment readiness.
Tip
For details about the Configuration tab, refer to Configuration.