


Add, edit and move portlets in the Control Center dashboard from GravityZone
Control Center dashboard provides quick security overview of all protected endpoints and network status. Dashboard portlets display various real-time security information using easy-to-read charts, thus allowing you to quickly identify any issues that might require your attention.
This article explains how to add, edit and move portlets in Control Center dashboard.
Adding a new portlet to the dashboard
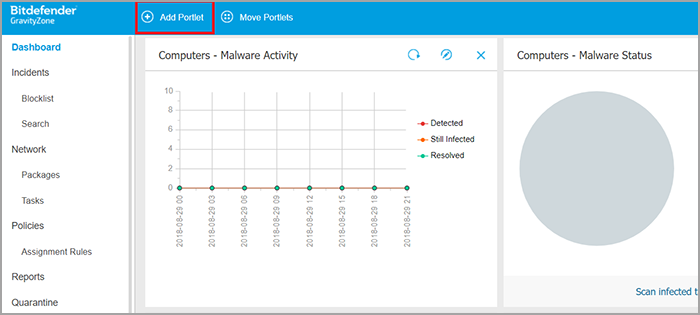
- Go to the Dashboard from the left-side menu.
- Click the Add Portlet button at the upper side of the console. The configuration window is displayed.
- Under the Details tab, configure the portlet details:
- Endpoint type (Computers, Virtual Machines or Mobile Devices)
- Type of background report
- Suggestive portlet name
- The time interval for the events to be reported
- Under the Targets tab, select the network objects and groups to include.
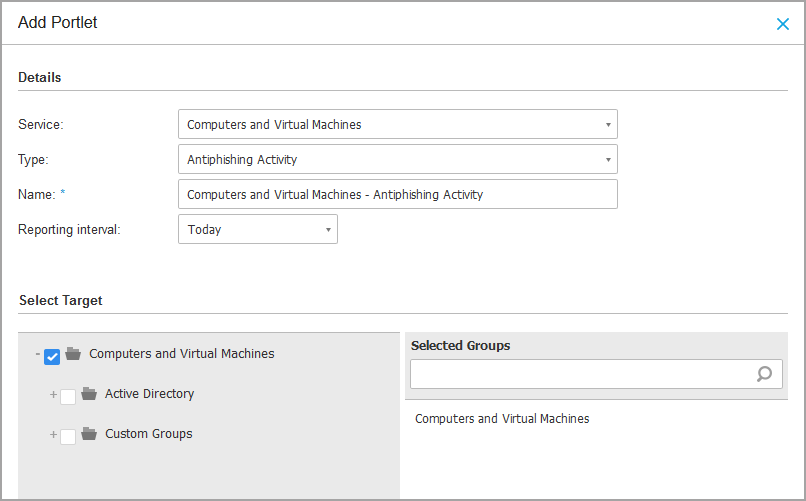
- Click Save.
Editing portlets
Some portlets offer status information, while other report on security events in the last period. You can check and configure the reporting period of a portlet by clicking the Edit Portlet icon on its title bar.
Moving portlets
- Go to the Dashboard page from the left-side menu.
- Click the Move Portlets button at the upper side of the console. The portlet map window is displayed.
- Drag and drop each portlet to the desired position. All other portlets between the new and old positions are moved preserving their order. You can move portlets only within the positions already taken.
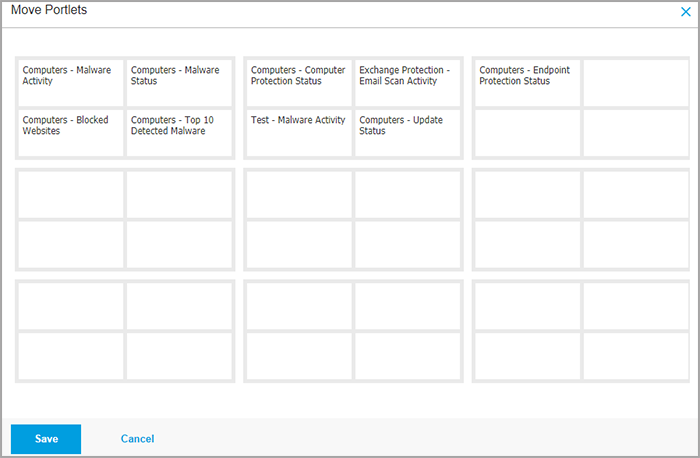
- Click Save.
Video Tutorial
You can watch a video tutorial on the topic here.
Can't find a solution for your problem?
Open an email ticket and we will answer the question or concern in the shortest time possible.
 Australia:
(+61) 1300 888 829, (+61) 385 956 732
Australia:
(+61) 1300 888 829, (+61) 385 956 732 Canada:
(+1) 647 977 5827, (+1) 647 367 1846
Canada:
(+1) 647 977 5827, (+1) 647 367 1846  Deutschland:
(+49) 2304 9993004
Deutschland:
(+49) 2304 9993004  España:
(+34) 937 370 223
España:
(+34) 937 370 223
 France:
+33(0)184070660
France:
+33(0)184070660  New
Zealand: (+64) 0800 451 786
New
Zealand: (+64) 0800 451 786  Osterreich:
(+49) 2304 9993004
Osterreich:
(+49) 2304 9993004  România:
(+40) 21 264 1777, (+40) 374 303 077
România:
(+40) 21 264 1777, (+40) 374 303 077  Schweiz:
(+49) 2304 9993004
Schweiz:
(+49) 2304 9993004  United
States: (+1) 954 414 9621, (+1) 954
281 4669
United
States: (+1) 954 414 9621, (+1) 954
281 4669  United
Kingdom: (+44) 2036 080 456, (+44) 2080 991 687
United
Kingdom: (+44) 2036 080 456, (+44) 2080 991 687  WorldWide: (+40) 31 620 4235,
(+40) 374 303 035
WorldWide: (+40) 31 620 4235,
(+40) 374 303 035