Introducing GravityZone Security Data Lake

December 02, 2025

Across your organization's infrastructure, all devices like firewalls, servers, endpoints, applications (e.g., BEST agent), and cloud services are constantly generating their own unique telemetry, often in different formats (log, txt, JSON, csv, etc.) and sizes. This volume of data creates a critical operational challenge: it is impossible to manually parse, search, or effectively correlate security events across platforms.
Bitdefender GravityZone Security Data Lake brings together SIEM operations with scalable data lake storage and advanced analytics. By unifying these capabilities, the platform ingests, correlates, and provides long-term access to telemetry from various resources, such as network devices, operating systems, applications, and cloud services, empowering your security operation teams with intelligence for threat hunting.
Security Data Lake Overview
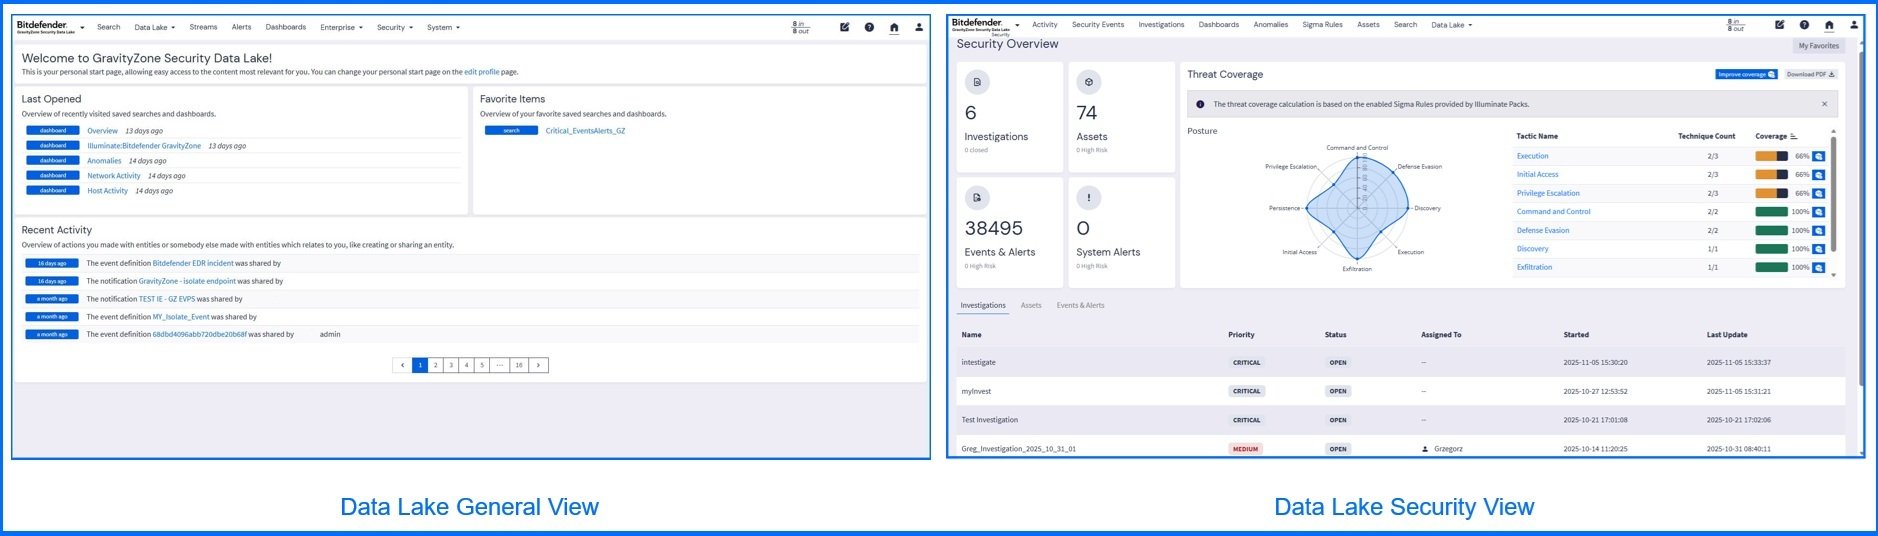
Security Data Lake provides you with two log view perspectives: General and Security views. The General view provides you with the ability to search data, identify and monitor events, configure alerts, notifications, and use the correlation engine to analyze sequences of events. Security view provides enriched context by risk-based insights and behavioral analysis, allowing your security team to detect, investigate, and prioritize threats.
Data Collection and Enrichment
The Security Data Lake accepts data from your assets via Inputs. Each input type is designed to handle specific data formats or communication methods. Out of the box includes predefined inputs dedicated to firewalls (such as Fortinet, Palo Alto Networks, and Check Point) and cloud services (e.g., AWS S3, GCP Log Events, and Office 365 Log Events). You can collect events from any resource using standard protocols like Syslog, NetFlow, and Raw HTTP. You can find the full list of supported input types on our Bitdefender Support Center here.
Logs from Inputs are filtered in real-time by Streams based on criteria such as message source, severity, content, or other specific conditions. These Streams are either pre-configured via Illuminate Packages or custom-defined by you. Pipelines can transform and process messages coming from Streams by a series of rules, allowing you to modify, enrich, or drop log messages before they are indexed. Using them, you can build your own custom parsers to handle unique or complex log formats.
To illustrate the data flow, consider a security event from a custom application where the Input accepts a raw text log: [2025-10-28 10:00:00] User 'jsmith' failed login from IP 192.168.1.100. A custom Stream named "Failed Logins" is configured to only match logs where the message contains the string "failed login". A custom Pipeline then executes the rule to extract the IP address (192.168.1.100) and uses a lookup table to determine the associated geolocation for the IP, inserting enriched fields as new, searchable data points: user_geolocation: "New York" is an example.
Defining Events and Alerts
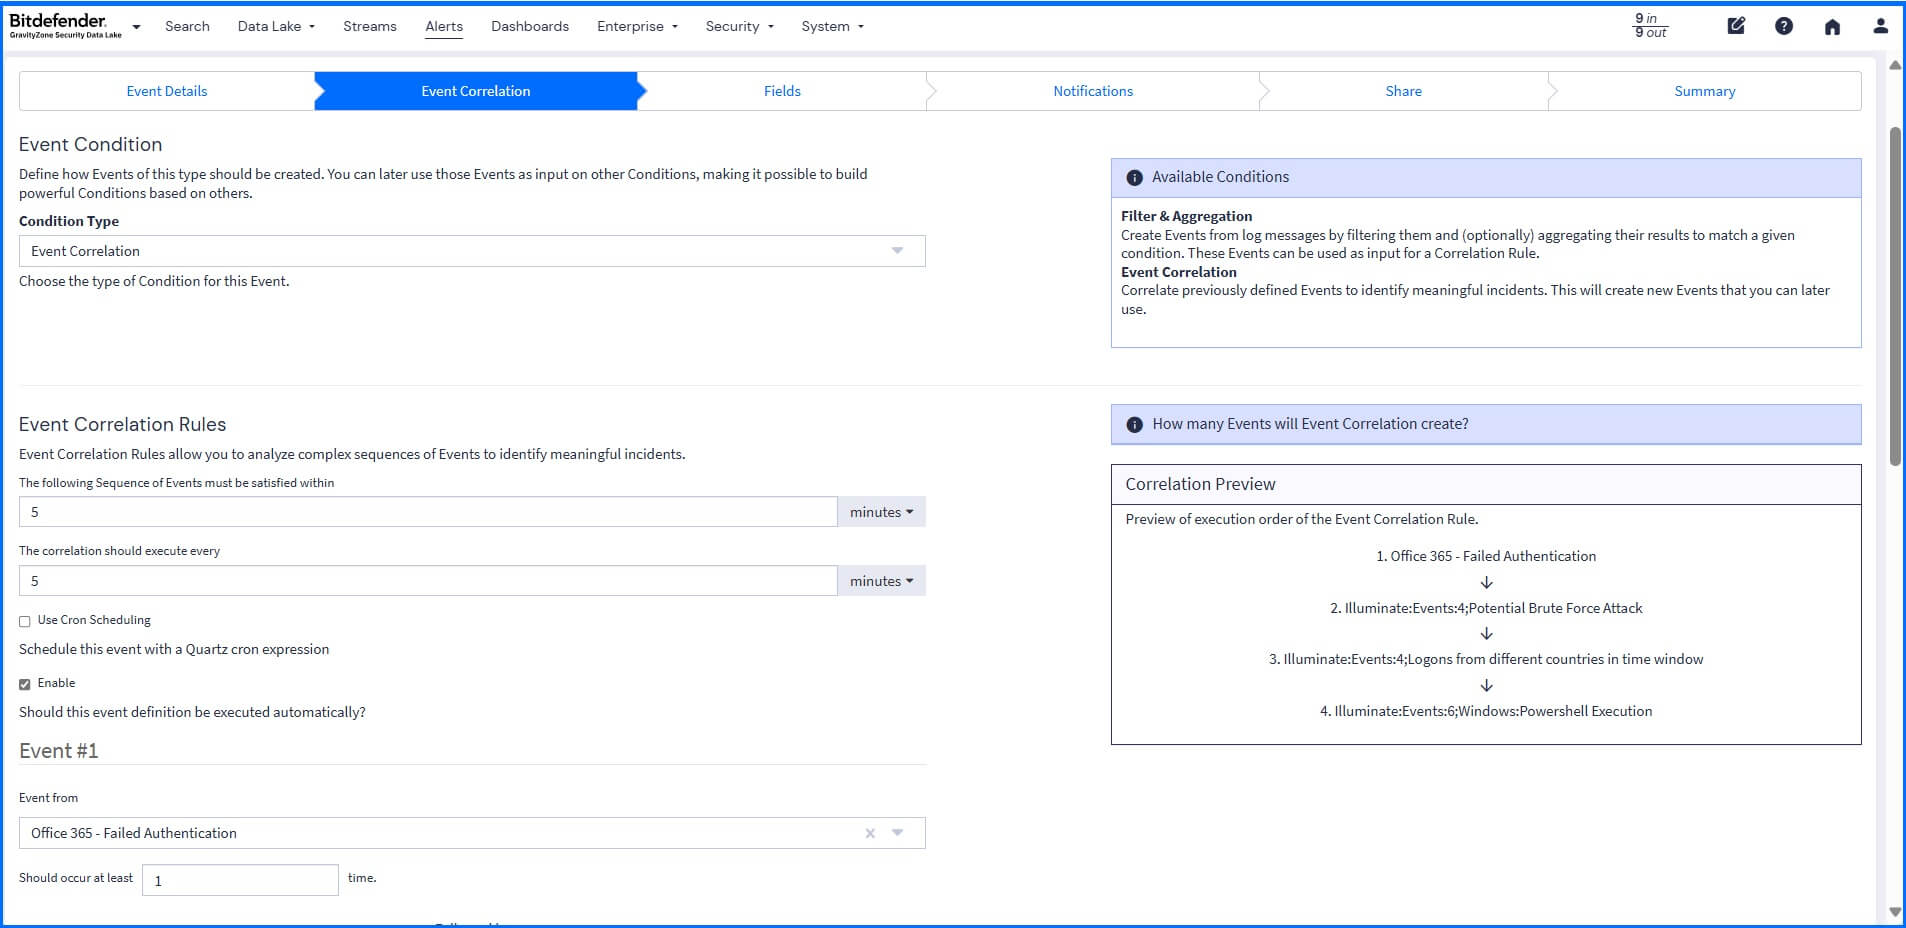
Events are defined by criteria that automatically process and examine incoming logs. These criteria are included in predefined content packs, such as the Events Illuminate Pack, which provides comprehensive, expert-defined security events, alongside rules you can define. In your own rules, you can use the correlation engine to analyze complex sequences of events. For example, it can correlate a failed login on one server followed by a successful login from a different country to trigger an event. This correlation connects the dots between isolated events to build a complete threat detection that can be used for your investigations.
Once a security event is identified, you can configure a Notification that can be sent directly to you or integrated into other systems like Slack, Microsoft Teams, and PagerDuty, or you can configure an HTTP API notification to trigger API calls. This can be used to generate automated responses, such as isolating an endpoint or adding it to a quarantine list on your firewall.
Search and Visualization
All ingested data is indexed into a searchable format, ready for complex queries, dashboards, and reports in real-time. Any search query can be saved or exported, allowing for easy reuse of specific configurations and sharing across your team. For complex search queries that require defining a value multiple times, you can define parameters once and reuse them as needed. You can further drill into the data using filters. For example, when searching within Bitdefender Telemetry Messages, you can create filters to query only logs for a specific host or process.

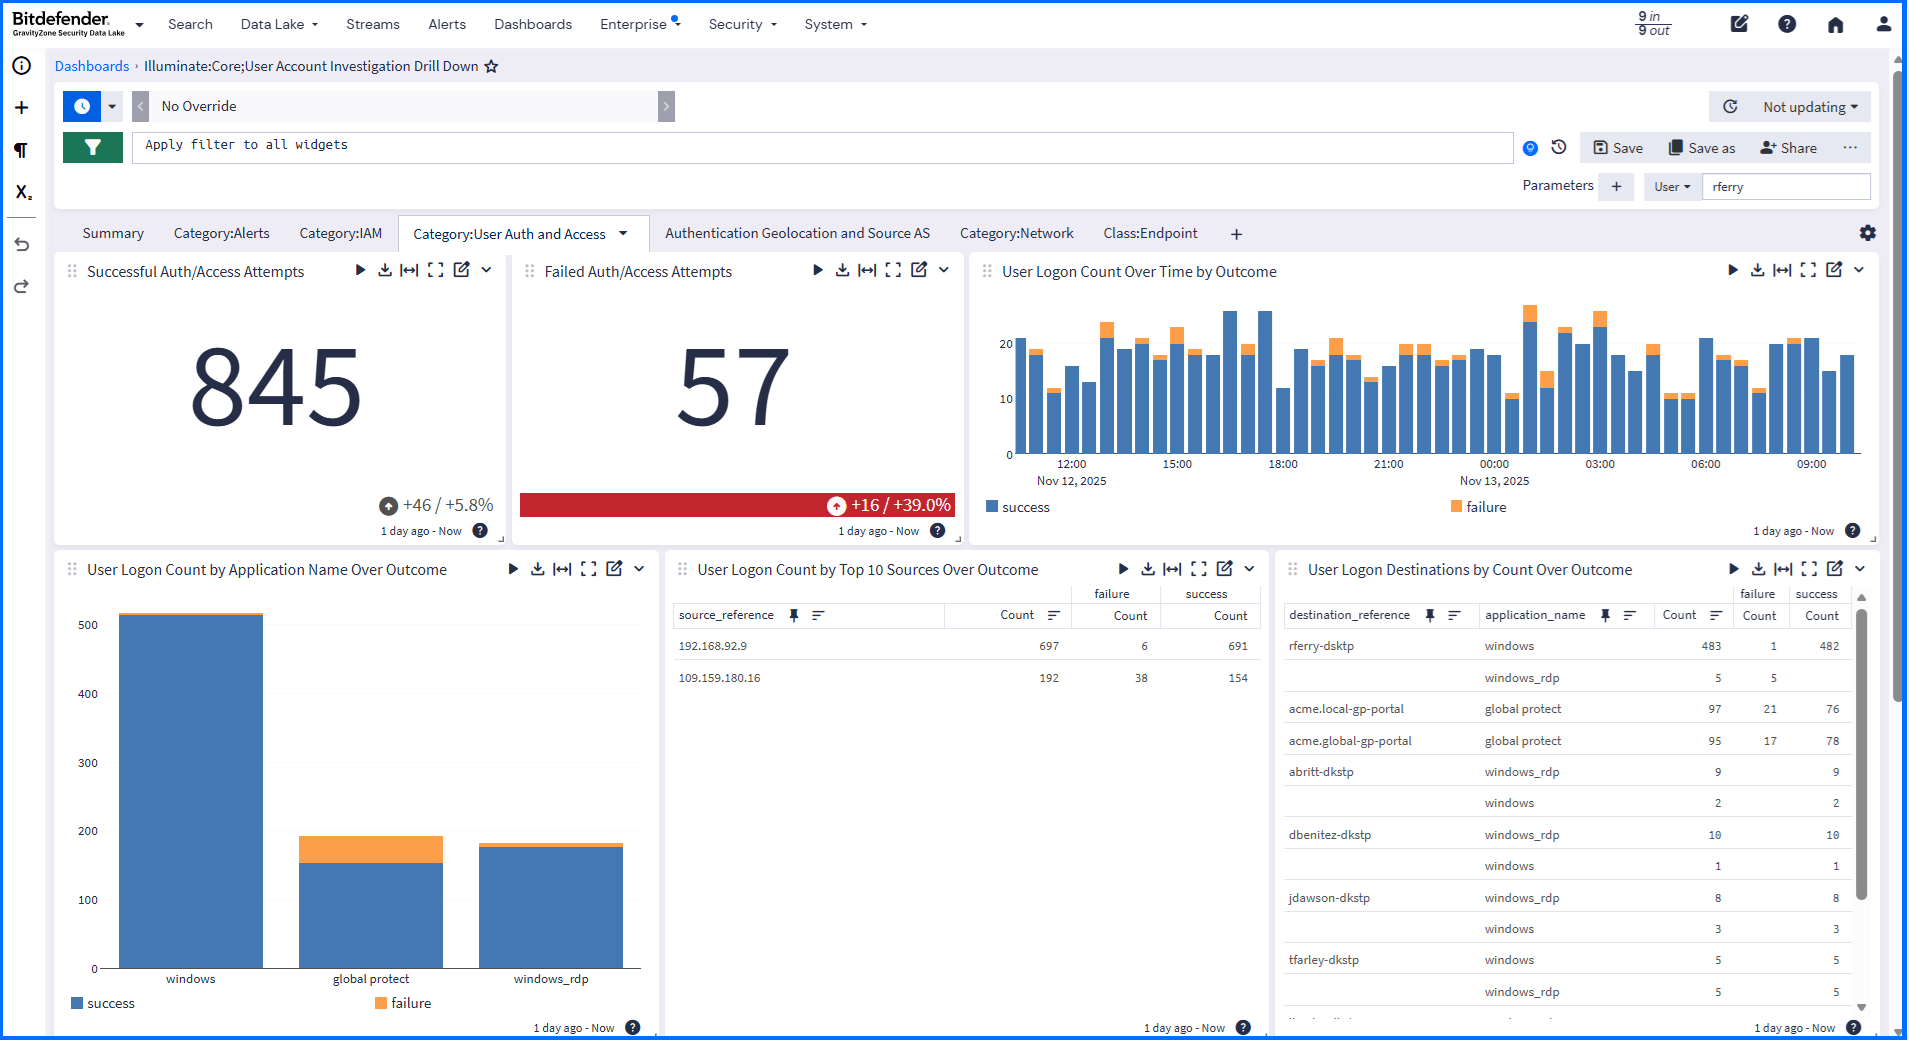
To display real-time or historical data, use customizable visual dashboards. These dashboards allow you to monitor, analyze, and visualize key metrics in a single, centralized location. This includes specialized device or user account investigation dashboards that offer filtered views for high-priority assets like usernames and IP addresses.
Proactive Threat Hunting with Security View
The Security Overview dashboard provides you, at a glance, with a comprehensive overview of your active investigations, assets, events, system alerts, and threat coverage.
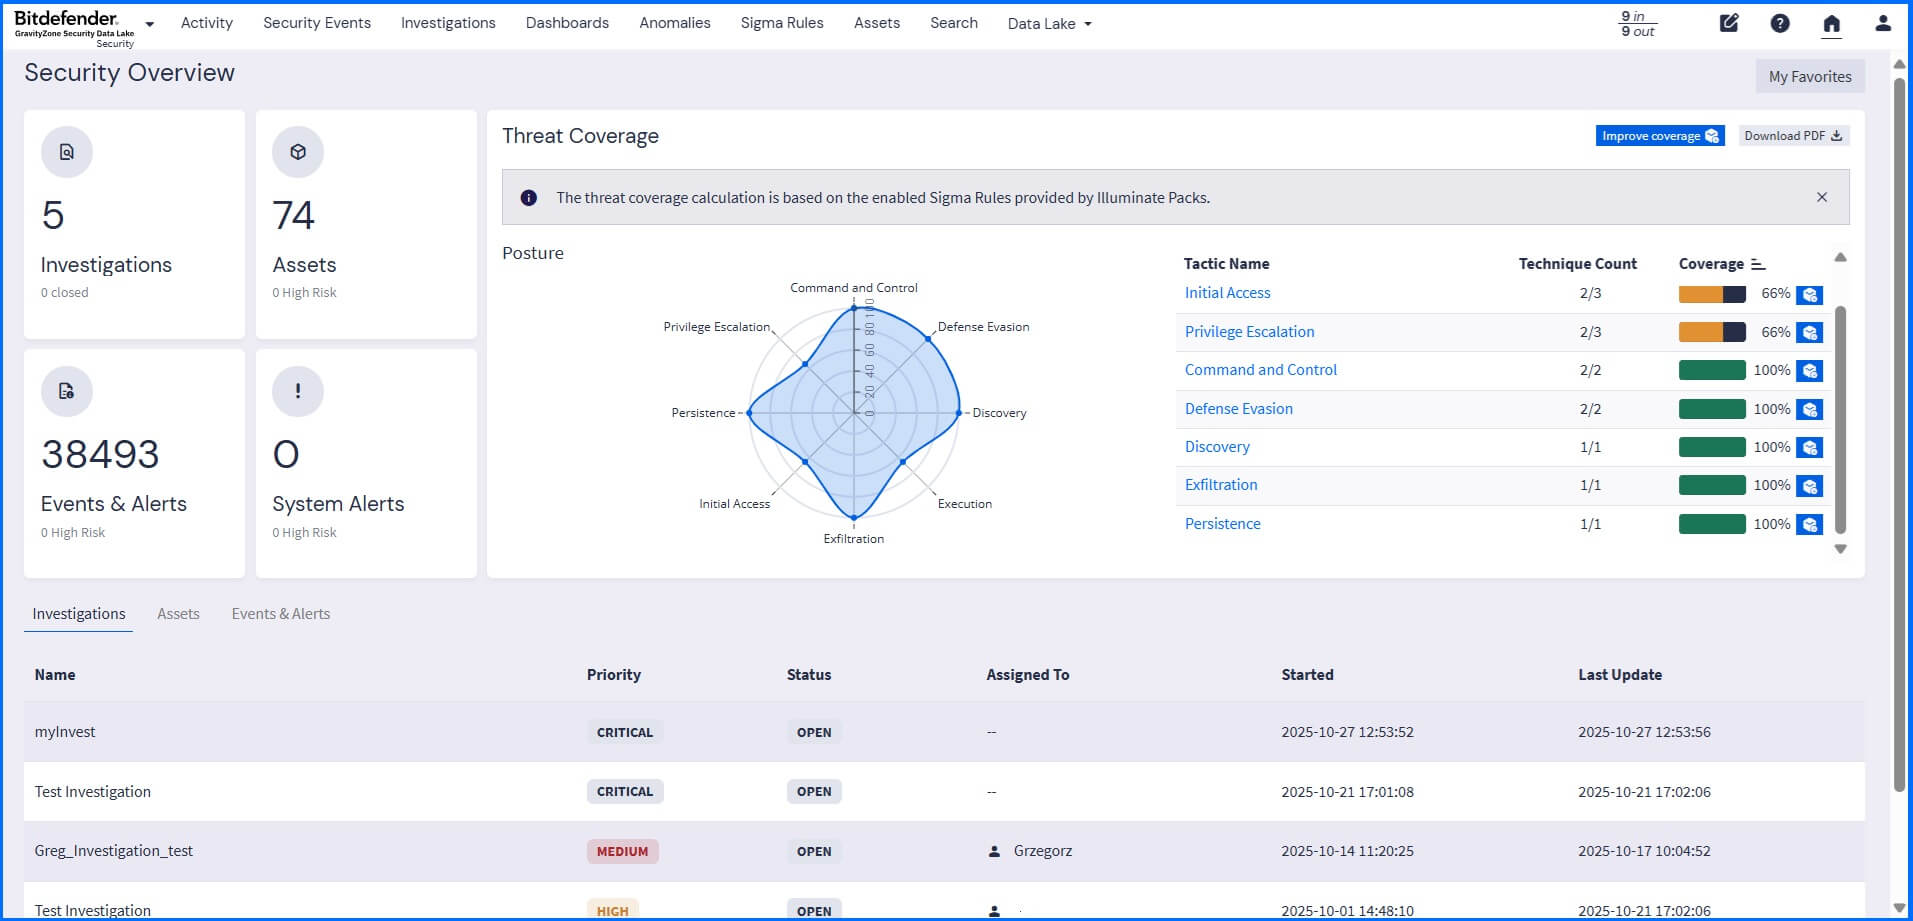
The threat coverage spider chart displays the results of Sigma Rules (security detection rules that focus on adversary behavior) applied to collected logs. All the rules are mapped and grouped to the tactics and techniques listed in the MITRE ATT&CK Matrix.
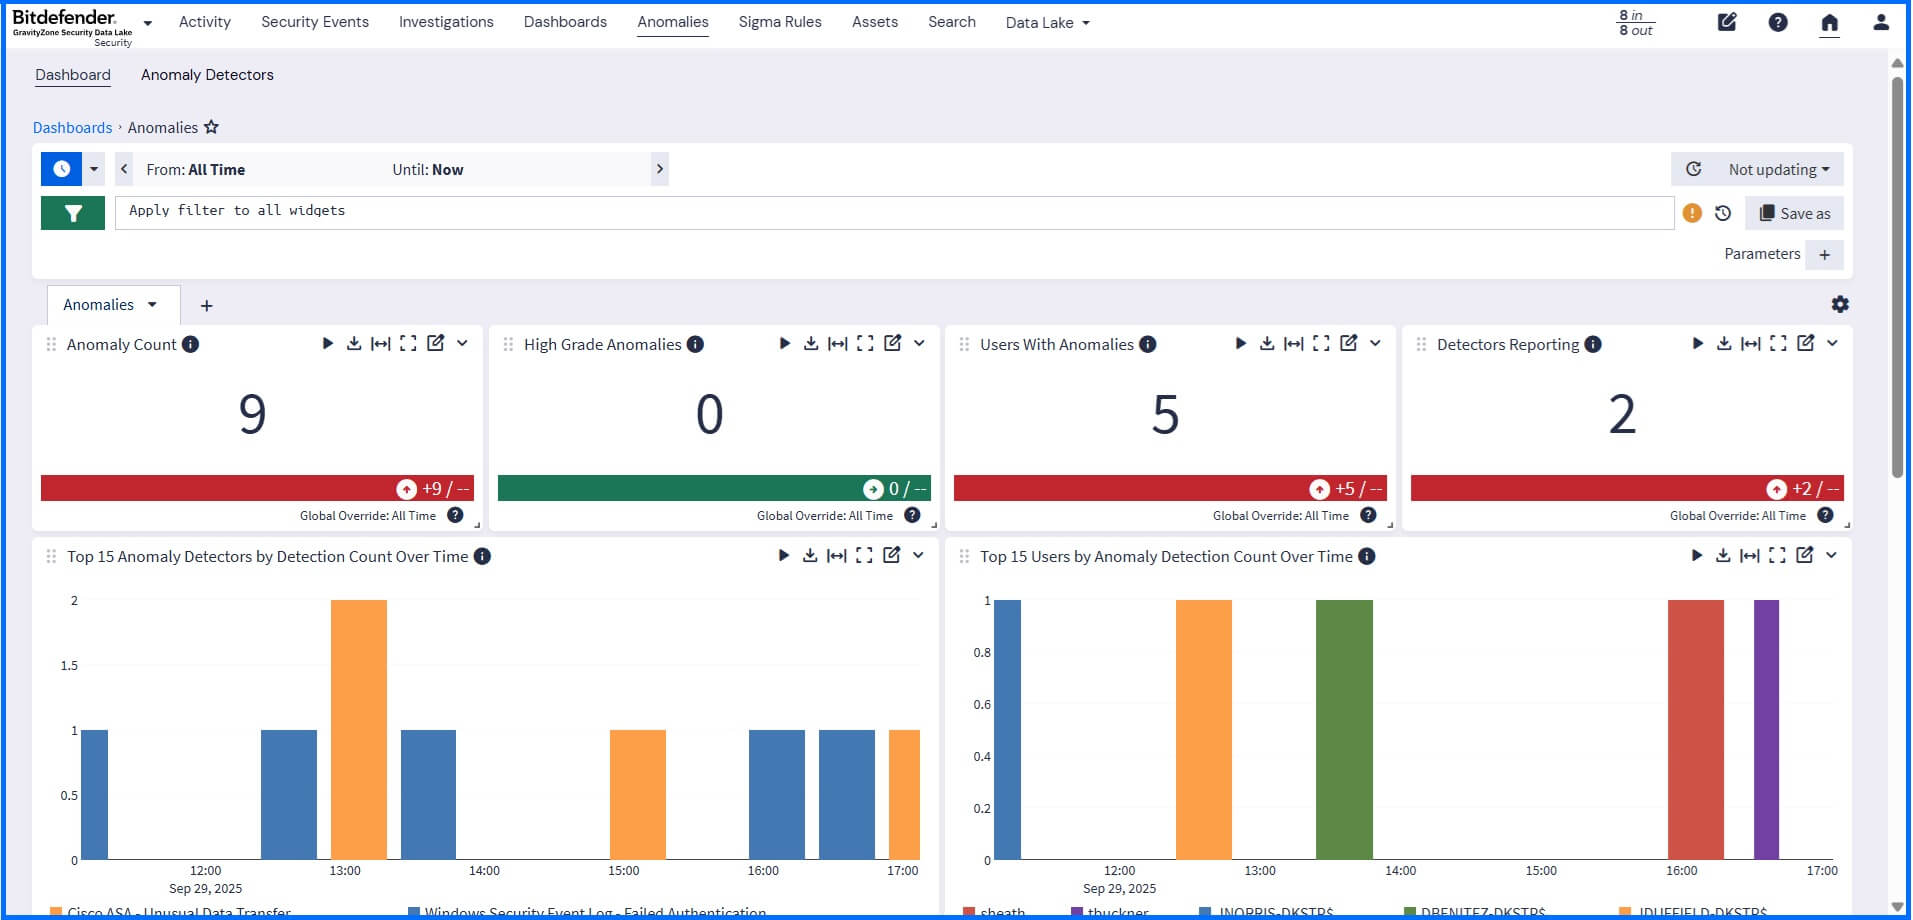
Use anomaly detection to identify deviations from normal organizational activity. You can choose exactly which products or data sources to monitor for unusual behavior. Results are available in a dedicated visual dashboard. Using search functionality, you can drill down to identify the root cause of the anomalous behavior.
Managing Investigations
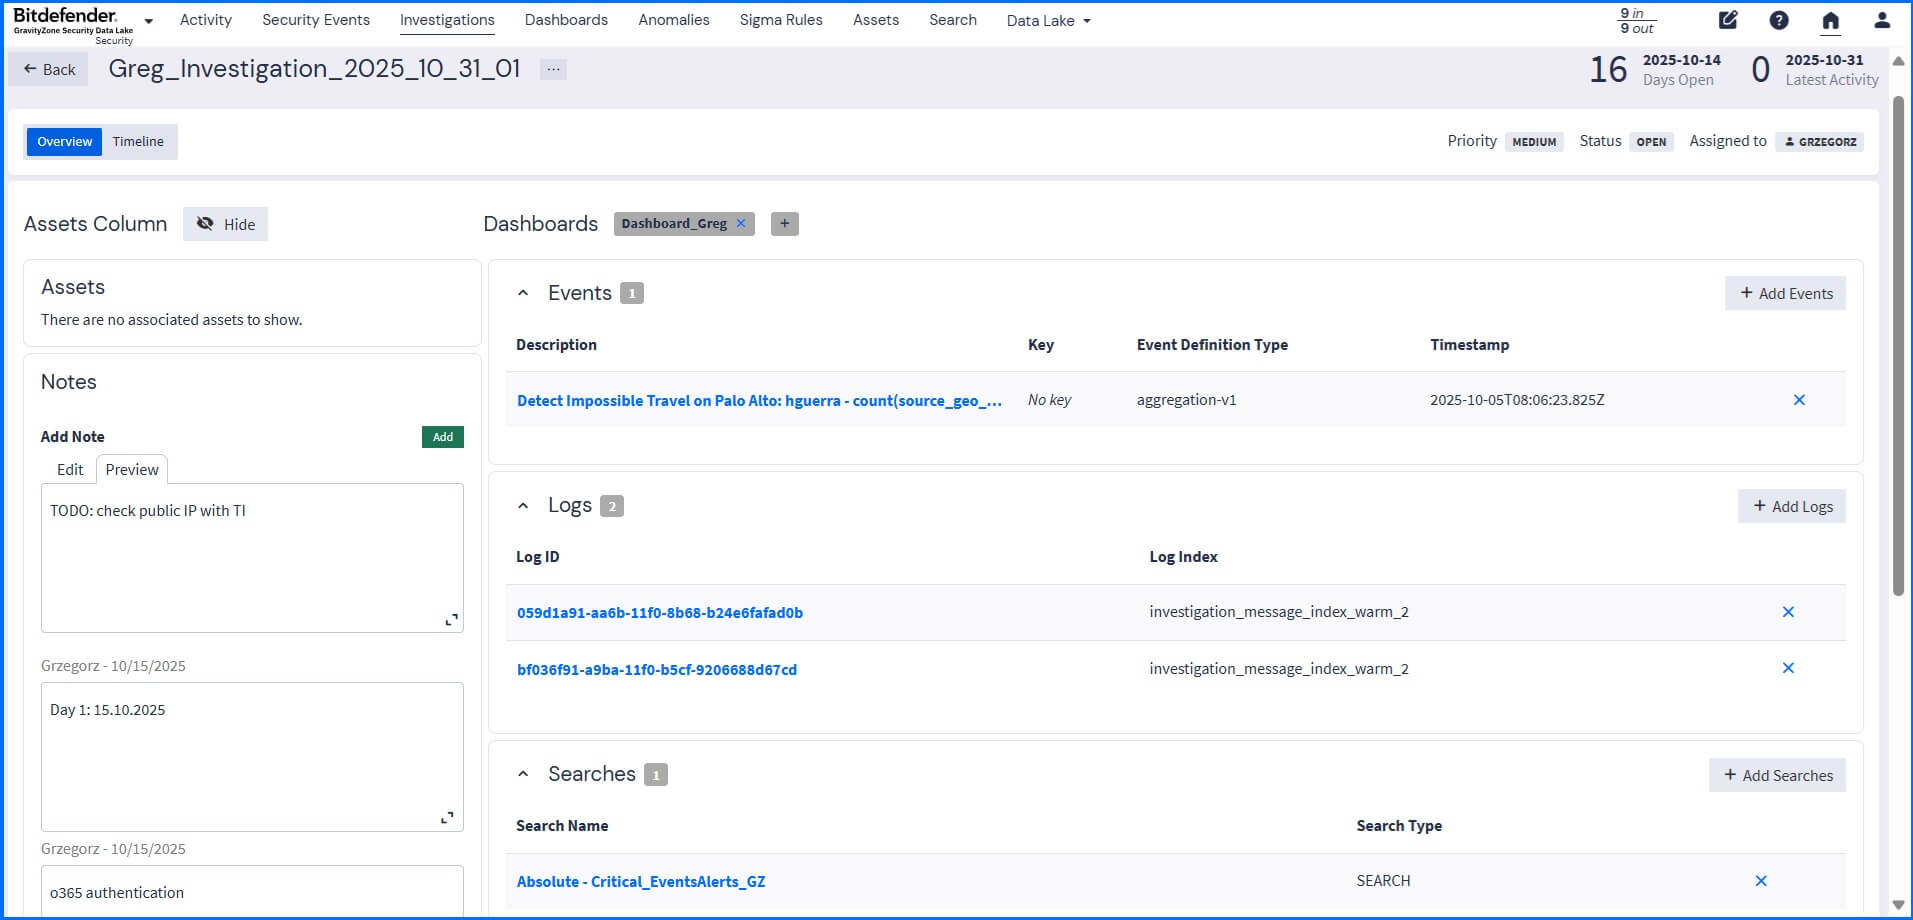
You can start your investigation based on a high-risk trigger, such as a received notification, an anomaly detection, or a high asset risk score, that requires immediate analysis. When creating an investigation, you can add dashboards, logs, saved searches, and associated events (including those resulting from anomaly detection) as evidence entities. This provides a unified context of an issue, and integrated timeline functionality outlines key events and messages that are part of the investigation.
Compliance Requirements
Security Data Lake enables you to meet compliance requirements through the centralized collection and long-term retention of all security and activity logs. It uses tiered retention, maintaining real-time search across historical logs for investigations and compliance while significantly optimizing storage costs by minimizing reliance on expensive hot-tier infrastructure used in standard SIEM solutions.
To streamline auditing for specific regulatory frameworks, you can use the Illuminate Compliance package, which includes standards like NIST SP 800-53 Rev 5, PCI DSS v4.0, and US CMMC 2.0 Level 1.
Since event logs contain documentation of activity occurring across the environment, they act as essential documentation for audits against standards such as General Data Protection Regulation (GDPR), Payment Card Industry Data Security Standard (PCI DSS), Federal Information Security Management Act (FISMA), and the Health Insurance Portability and Accountability Act (HIPAA).
Data Lake in Action: Bitdefender MDR
The Security Data Lake, when integrated with Bitdefender Managed Detection and Response (MDR) service, expands security view by granting access to third-party telemetry (firewalls, cloud services, etc.) across your entire environment. The list of supported 3rd party firewall telemetry for Bitdefender MDR includes Palo Alto Networks, Check Point, Cisco ASA, Fortinet, Juniper, pfSense, and SonicWall.
Our MDR team can run queries across all enriched data to quickly and precisely detect Indicators of Compromise (IoCs), moving beyond Bitdefender EDR and XDR events to correlate activity across the entire infrastructure. This capability allows for identifying threats earlier in the attack chain, reducing noise through risk-based prioritization.
Summary
The GravityZone Security Data Lake integrates scalable storage with SIEM operations, enabling your security team to achieve unified, proactive threat detection. It does this by eliminating data silos and providing real-time and historical analytics, correlation, and enrichment capabilities, accelerating your Mean Time to Detect (MTTD) and Mean Time to Respond (MTTR).
For general information about Security Data Lake and its benefits, please visit the official Bitdefender GravityZone Security Data Lake page, here.
For a more in-depth technical understanding of Security Data Lake capabilities, please visit our Bitdefender TechZone, here.
Discover the Security Data Lake full potential with our dedicated video masterclasses: Redefining SIEM with Bitdefender - GravityZone Security Data Lake
tags
Author
Grzegorz Nocon is a graduate of the Faculty of Physics at the University of Silesia. With over 16 years of experience in the IT industry, he currently works as a Technical Marketing Engineer at Bitdefender. A strong supporter of a holistic approach to security and passionate about solving security problems in a comprehensive and integrated way. Outside of work, an avid CrossFit enthusiast and a lover of fantasy literature.
View all postsYou might also like
Bookmarks
